
Analyze with AI
Get AI-powered insights from this Mad Devs article:
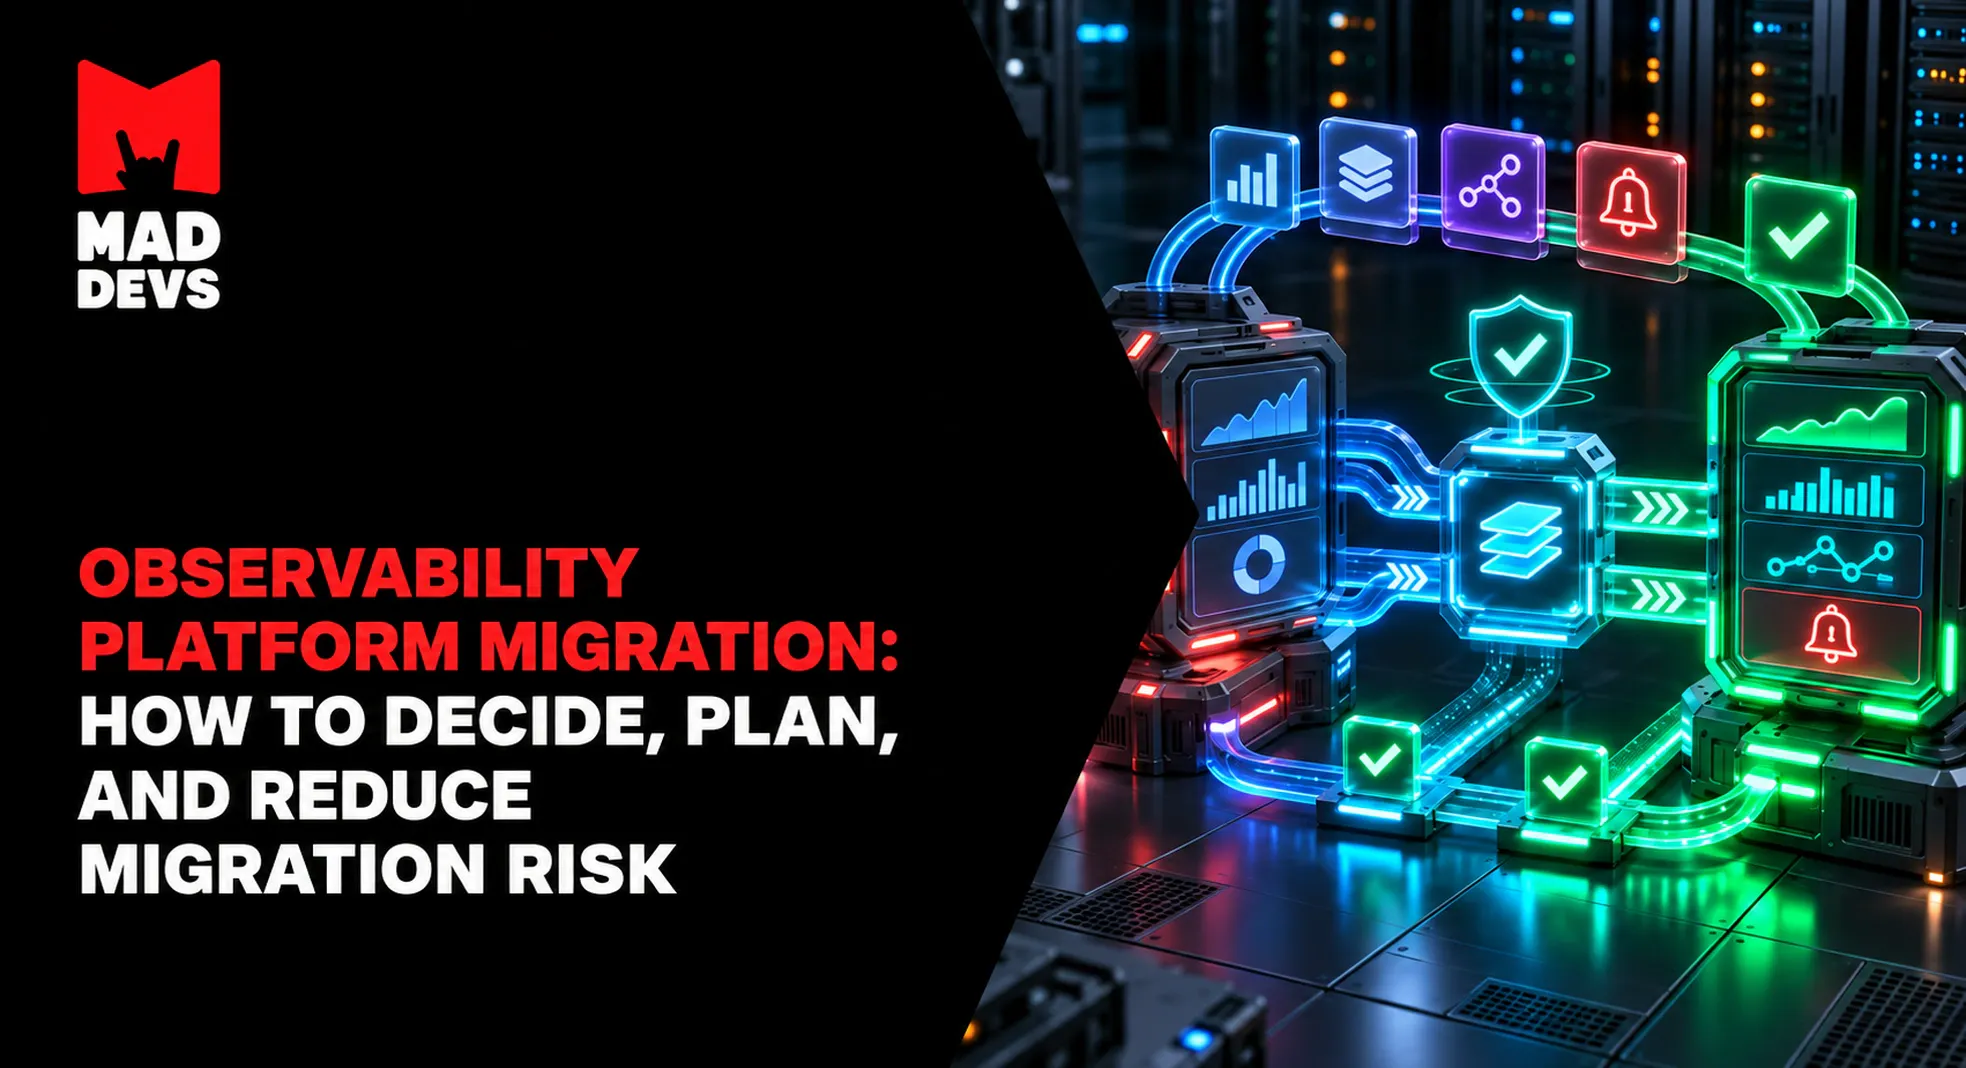
An observability platform can become a liability gradually. Telemetry volume grows, pricing becomes harder to predict, proprietary instrumentation spreads, and teams accumulate dashboards, monitors, SLOs, and integrations that no one fully owns. By the time leaders consider a replacement, the platform is no longer just a data store. It is part of the organization’s incident-response system.
That changes the migration question. Moving logs, metrics, and traces is necessary, but it is not proof that the new platform is ready. A successful observability migration preserves the ability to detect, investigate, and respond to the failures that matter. This guide provides a decision framework, scope matrix, phased plan, and validation gates for doing that without relying on a big-bang cutover. Readers who need category fundamentals can start with our observability overview.
Key takeaways
- Cost is a common trigger, but a migration needs a measurable business and operational case.
- The scope includes instrumentation, pipelines, dashboards, alerts, SLOs, integrations, and investigation practices—not only telemetry.
- OpenTelemetry can reduce collection-layer coupling, but it does not automatically migrate queries or operational workflows.
- Parallel operation creates evidence of operational parity when the architecture and budget permit it.
- Retire the old platform only after critical monitoring and incident workflows pass agreed acceptance tests.
When does an observability platform migration make sense?
Migration makes sense when the current platform creates a persistent constraint that configuration, commercial negotiation, or selective optimization cannot resolve. Define that constraint in measurable terms before comparing replacements.
Rising cost at scale. A platform’s cost curve may stop matching its value as ingestion, cardinality, retention, or the number of monitored hosts grows. Compare a realistic future-state bill with the full migration cost, including engineering time and temporary dual-platform spend. Diagnose the source first: Mad Devs’ cloud cost optimization experience includes removing redundant metrics and reducing telemetry traffic—changes that may improve the current stack without replacing it.
Vendor lock-in. Switching becomes progressively harder when applications use proprietary agents, teams depend on a vendor-specific query language, and automation targets vendor APIs. Migration may be justified if portability has strategic value, but “open” collection alone does not eliminate dependency in dashboards, alert rules, and operating procedures.
Platform limitations. The present system may no longer meet requirements for scale, retention, query performance, data residency, integrations, or telemetry ownership. Turn each limitation into a testable requirement. For example, specify the investigations that time out, the retention required for a regulated workload, or the integrations that must work—not merely “better scalability.”
Tool sprawl. Overlapping platforms can give different teams conflicting views of the same incident. Consolidation can reduce duplicated pipelines and fragmented on-call practices, provided the target platform meets the distinct needs that caused teams to adopt those tools.
Organizational change. A platform-engineering program, cloud consolidation, merger, or new data-governance standard can justify common collection and operational conventions. The decision still needs owners, funding, and acceptance criteria; standardization is not a substitute for a migration case.
When migration may not be justified
A full migration may cost more than the problem it solves. Test lower-disruption options first: sampling, shorter or tiered retention, telemetry filtering, removal of unused high-cardinality dimensions, pricing renegotiation, or better platform configuration. If those measures produce the required cost, reliability, or governance outcome, document the result and defer migration. The decision gate should compare “optimize and stay” with “migrate,” not compare only replacement vendors.
What actually has to move during an observability migration?
Telemetry parity is not the same as operational parity. Inventory the assets that turn raw signals into action:
- Instrumentation: vendor agents, SDKs, auto-instrumentation, and custom spans or metrics.
- Telemetry pipelines: collectors, shippers, processors, routing, enrichment, filtering, and sampling policies.
- Signals: metric series, log events, traces, attributes, timestamps, and exemplars where used.
- Operational content: dashboards, saved queries, alerts, monitors, SLOs, and notification routes.
- Integrations: incident management, chat, ticketing, cloud services, Kubernetes, IAM, and automation APIs.
- Operational knowledge: runbooks, service ownership, naming conventions, triage habits, and escalation paths.
The following Observability Migration Scope Matrix is our practical framework for connecting inventory to cutover evidence.
| Area | What to inventory | What to validate before cutover |
|---|---|---|
| Instrumentation | Agents, SDKs, auto-instrumentation, custom code | Equivalent coverage for critical services and operations |
| Metrics, logs, and traces | Sources, volume, attributes, timestamps, cardinality | Signal correctness, usable context, and expected sampling |
| Dashboards | Active panels, variables, queries, owners | Comparable meaning and results for representative periods |
| Alerts | Rules, thresholds, labels, suppression, routing | Correct evaluation, firing, deduplication, and delivery |
| SLOs | SLIs, windows, objectives, burn-rate rules | Equivalent calculations and escalation behavior |
| Integrations | Incident, ticketing, chat, IAM, cloud, automation | Workflow continuity and correct permissions |
| Operations | Runbooks, owners, investigation paths | Engineers can diagnose representative failures |
Do not automatically migrate everything in the inventory. Usage data and owner interviews should separate business-critical assets from duplicates, obsolete experiments, and dashboards without a decision-making purpose.
How to assess migration complexity before you commit
Estimate effort from dependencies, not from service count alone. A small estate with proprietary instrumentation and bespoke monitors can be harder to move than a larger, standardized environment.
Instrumentation lock-in
Map every instrumentation method to an owner and target approach. Identify proprietary APIs, semantic conventions, injected agents, and custom context propagation. Validate replacement instrumentation on representative request paths, including asynchronous jobs and cross-service traces. Count code changes and deployment waves rather than assuming an agent swap is configuration-only.
Telemetry volume and cardinality
Measure daily volume by signal and service, peak rates, attribute cardinality, retention, and sampling. Determine which data is used in alerts or investigations. Remove demonstrably redundant telemetry before sizing the destination; otherwise, the organization pays to reproduce existing inefficiency and may misjudge target capacity.
Dashboards, alerts, and SLOs
Record owners and recent use, then classify each asset as migrate, redesign, archive, or retire. Query-language differences can change aggregation, missing-data handling, and grouping even when a panel looks familiar. For critical assets, keep the original query, expected output, test period, and acceptance result as evidence.
Integrations and on-call workflows
Trace the path from evaluation to human response: alert rule, labels, notification policy, contact point, incident tool, team schedule, and runbook. Include service accounts, IAM roles, API consumers, and maintenance-window automation. Test delivery to a controlled endpoint before production cutover.
Historical data
Decide whether history must be imported, exported to an archive, or retained in a read-only source system. Base the choice on investigation, audit, and compliance requirements. Moving years of data may add cost and complexity without improving current operations; losing required context can be equally expensive.
Team and operational readiness
Name the people who approve signal quality, dashboards, alerts, SLOs, security, and cutover. Reserve time for service owners and on-call engineers to run tests. A platform team cannot prove operational readiness alone if application teams are the people who investigate incidents.
Choosing a migration architecture
Choose an architecture according to risk, existing instrumentation, and the ability to run both systems—not according to a universal preference.
Direct replacement changes agents or SDK exporters and sends telemetry to the new backend. It has the fewest moving parts, but rollback and comparison can be difficult. Use it for a constrained scope where instrumentation is simple, downtime in visibility is tolerable, and tests are strong.
Collector or routing abstraction places a neutral collection layer between workloads and backends. The OpenTelemetry Collector is designed to receive, process, and export telemetry and can send to one or more open-source or commercial backends. This makes routing, batching, filtering, and temporary fan-out possible. It also introduces infrastructure that must be secured, scaled, and monitored. Mad Devs’ guide to OpenTelemetry in Kubernetes covers production Collector architecture in more depth.
Hybrid transition keeps some workloads on the source while others move in waves. This suits large environments with different service owners or instrumentation generations. It requires explicit rules for which platform is authoritative during each wave, or responders may consult conflicting data.
OpenTelemetry is not an observability backend, and it does not translate dashboards, monitors, SLOs, or runbooks. Treat it as a possible migration enabler, not a mandatory destination.
How to migrate without losing visibility
The safe pattern is a sequence of evidence-producing gates. Splunk’s migration documentation likewise separates discovery, telemetry enablement, monitoring configuration, validation, cutover, and stabilization, and advises completing a non-critical pilot before production migration.
1. Inventory the current state
Build a service-to-asset map covering sources, instrumentation, pipelines, signals, operational content, integrations, and owners. Add recent-use data where available. Mark unknown ownership as migration risk rather than silently assigning it to the platform team.
2. Define migration acceptance criteria
Write criteria before configuring the target. For a critical service, they might require its golden signals, trace context across designated boundaries, searchable log fields, tested alerts, equivalent SLO calculations, and working notification routes. Define tolerances where exact equality is unrealistic because query engines or sampling differ.
3. Start with a representative pilot
Choose a non-critical service that exercises real patterns: multiple signals, at least one dependency, meaningful dashboards, an alert, and an on-call workflow. The easiest stateless service can produce a misleading success. Confirm connectivity, naming, permissions, rollback, and target-platform support procedures before expanding.
4. Run platforms in parallel where feasible
Dual-write or fan-out representative telemetry for a bounded period when architecture and budget permit. Compare matched time windows and controlled events, not total ingestion alone. Check query results, missing attributes, dashboard semantics, alert state changes, trace continuity, and delivery paths. Protect production pipelines from backpressure: the comparison mechanism must not make application telemetry less reliable.
5. Migrate in waves
Select waves by service ownership, business criticality, instrumentation pattern, or signal type. There is no universally correct metrics-to-logs-to-traces order. Each wave needs an owner, entry criteria, tests, rollback conditions, and a recorded decision.
6. Validate operational parity
Run incident scenarios, not only data checks. Ask an on-call engineer to investigate a failed dependency, latency regression, or resource saturation using the new platform and current runbook. Record whether they could identify impact, narrow the cause, and reach the correct escalation path.
7. Cut over and stabilize
Make the new platform authoritative for agreed workflows, then watch data quality, alert behavior, support load, and pipeline health. Keep rollback available through the stabilization window. Communicate where responders should search and acknowledge alerts to avoid split operations.
8. Decommission deliberately
Retire the source only when critical assets have passed, unresolved exceptions have owners, historical-access obligations are met, and the rollback window has closed. Remove exporters, credentials, integrations, licenses, and obsolete runbooks in a controlled sequence. Decommissioning is a project phase, not a billing cancellation.
How to validate the new observability platform
Validation should progress from data transport to human response.
Telemetry validation: confirm expected signals arrive; resource and span attributes survive; timestamps and units are correct; trace context is continuous; sampling and filtering match policy; and collection delays stay within an agreed tolerance.
Query and dashboard validation: run key queries against matched windows and known events. Compare values, grouping, rates, percentiles, missing-data behavior, and timezone handling. A dashboard that renders successfully can still be wrong.
Alert validation: inject safe test conditions or replay known inputs. Verify rule state, thresholds, grouping, suppression, deduplication, and delivery. Labels deserve special attention: Grafana documents that each unique label combination defines a separate alert instance, so changed labels can alter notification behavior even when the numeric condition is unchanged.
SLO validation: compare SLI queries, event eligibility, windows, error budgets, and burn-rate alerts. Investigate discrepancies rather than accepting similar-looking percentages.
Incident-workflow validation: conduct a tabletop or controlled failure. The pass condition is that an engineer can establish impact, follow evidence across signals, contact the right owner, and make a response decision without falling back to the old platform.
Measure migration effectiveness
Track a small set of measures for each wave: the share of critical services with approved telemetry coverage; the pass rate for critical dashboards, alerts, SLOs, and integrations; alert delivery and routing results from controlled tests; pipeline errors and collection delay; and how often responders must return to the source platform during representative investigations. These measures do not replace judgment about a cutover, but they make gaps visible and give owners evidence for a go, hold, or rollback decision.
What makes observability migration expensive?
Migration cost is not the new platform’s license price. The major drivers are proprietary instrumentation, the number and diversity of services, telemetry volume and cardinality, custom queries and dashboards, alert and SLO semantics, historical-data requirements, integrations, retraining, and the duration of parallel operation.
Build a total-cost model with four lines: destination platform, migration engineering, temporary overlap, and ongoing operation of any new collection layer. Add risk allowances for unknown owners and untested assets. Avoid universal savings percentages; the result depends on current contracts, data shape, target architecture, and the amount of operational content worth preserving.
Example: migrating from a proprietary observability platform
Consider a hypothetical company with dozens of services, a proprietary APM suite, custom dashboards, and years of accumulated alerts. It wants more portable telemetry and less backend coupling.
The platform team first inventories instrumentation and operational assets, then identifies the critical user journeys and alerts. It introduces a neutral collection layer only for workloads where that reduces coupling, dual-exports pilot telemetry, and rebuilds the minimum critical dashboards and monitors. Service owners compare matched queries and run controlled incident scenarios. Services move in ownership-based waves; exceptions remain on the source with explicit deadlines. After a stabilization period, the company retains required history read-only, removes old agents and credentials, and ends the source contract.
This is not a claim about a Mad Devs client project or a prescription for leaving any named vendor. It illustrates how the scope matrix and validation gates fit together.
Observability platform migration readiness checklist
- Is the reason for migration measurable?
- Have lower-cost alternatives to migration been evaluated?
- Is the instrumentation and pipeline inventory complete?
- Which telemetry and attributes must be preserved?
- Which dashboards, queries, and alerts are business-critical?
- Are SLOs, labels, suppression rules, and notification routes documented?
- Are proprietary dependencies identified and owned?
- Can old and new platforms run in parallel safely and affordably?
- Are acceptance criteria and tolerances defined before implementation?
- Does the pilot represent real instrumentation and operational patterns?
- Can engineers test representative incident workflows?
- Are historical retention and access requirements addressed?
- Is rollback possible during every migration wave?
- Is there an explicit stabilization and decommissioning plan?
FAQ
What is observability platform migration?
When should a company migrate observability platforms?
Can OpenTelemetry make observability migration easier?
How do you migrate without losing alerts and dashboards?
How long should old and new platforms run in parallel?
Latest articles here