
Analyze with AI
Get AI-powered insights from this Mad Devs article:
Imagine launching a new feature only to discover hours later that it's causing widespread outages. Or, picture spending days debugging a critical issue with limited visibility into your system's inner workings. These are just a few scenarios where the lack of observability can cripple software development and user experience.
Let's delve into the concrete use cases of observability, explore its tangible benefits, and unleash the tools that elevate your tech team's performance.
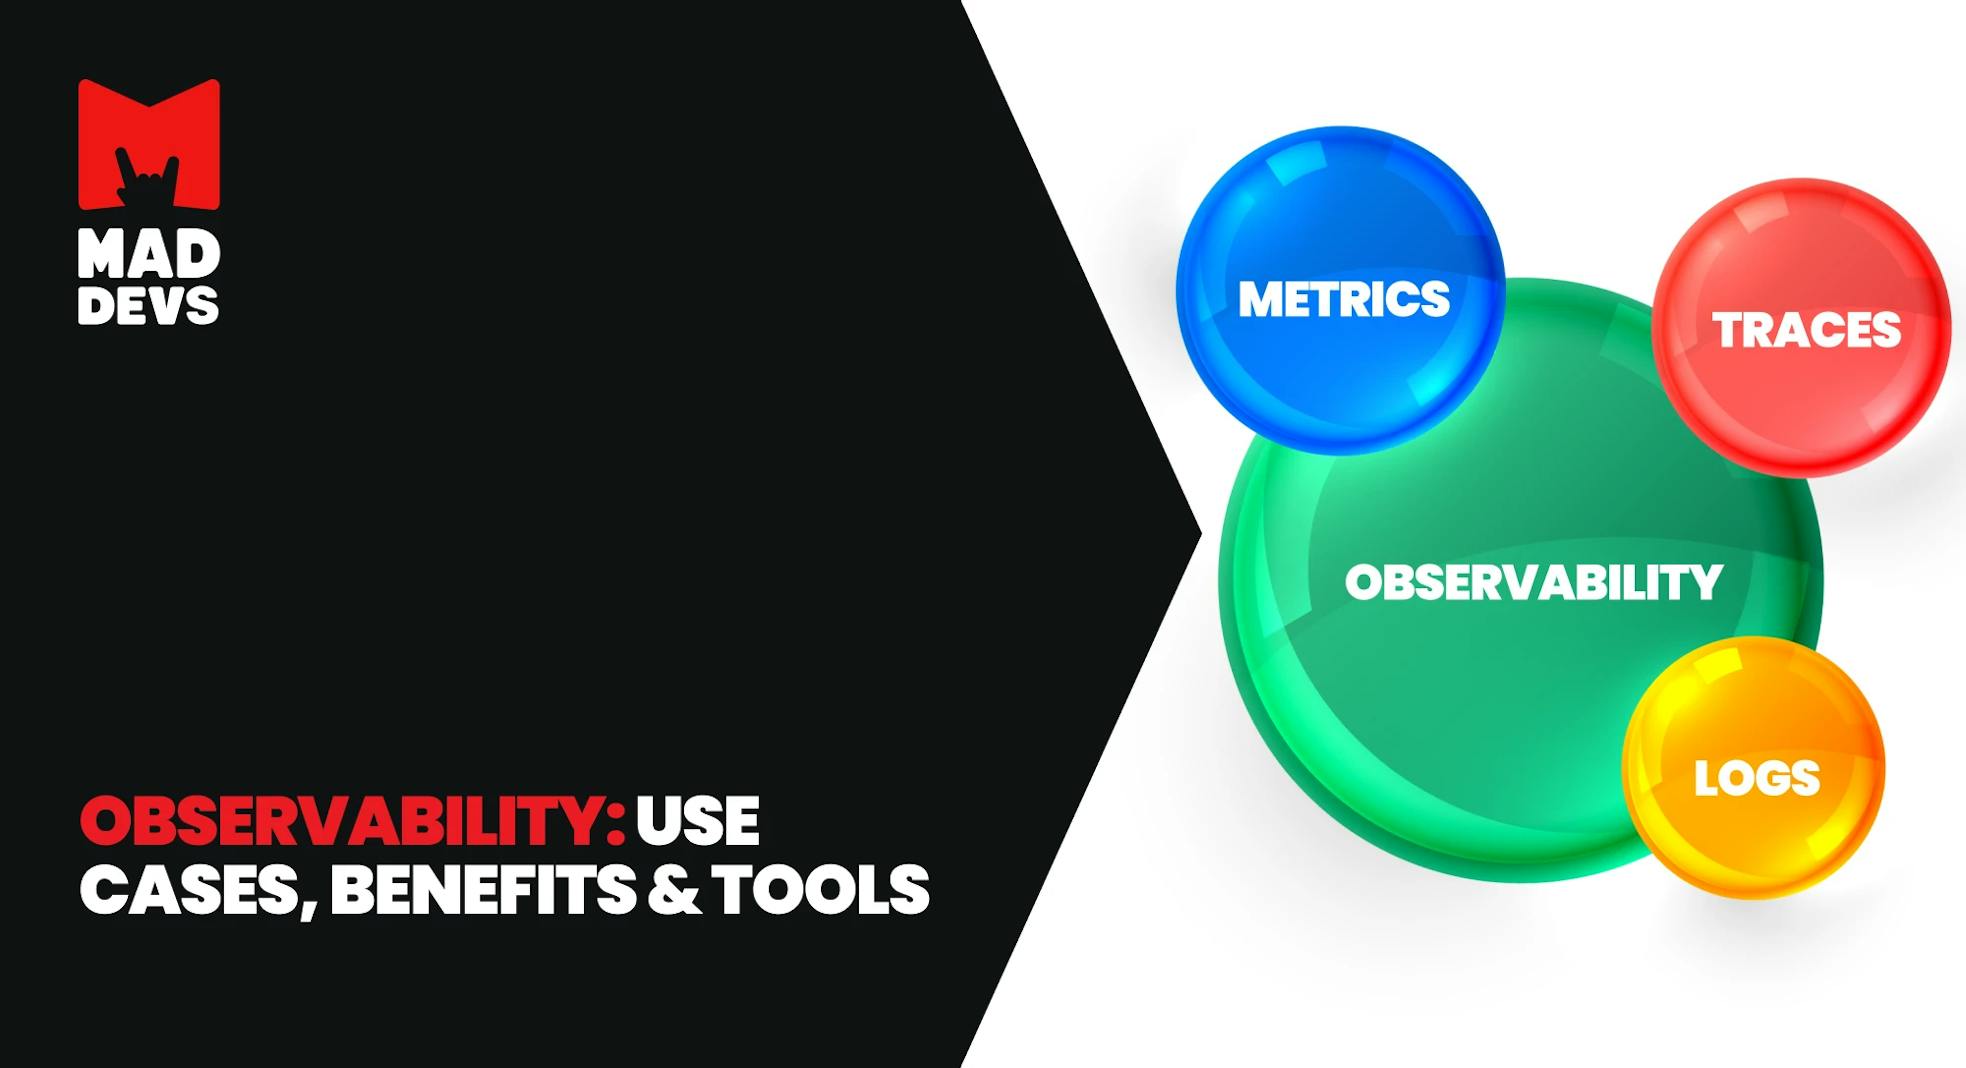
Observability is all about gaining deep insights into the health and performance of your systems. It's like having a superpower that lets you understand how your software behaves, from the infrastructure level (servers, networks) to the application level (code, user interactions).
Use cases in software development
Continuous integration and continuous deployment (CI/CD)
Observability transforms CI/CD from a black box into a transparent system, providing real-time tracking of build and deployment processes. It surfaces potential issues early, empowering teams to address integration challenges before they escalate quickly.
Benefits:
- Reduced downtime: Observability enables early detection of integration issues, minimizing the risk of deployment failures and ensuring a smoother CI/CD pipeline.
- Faster time-to-market: Swift identification and resolution of integration problems expedite the release process, enabling quicker delivery of new features.
Example of tools:
Jenkins
![]()
Jenkins is an open-source automation server with a wide range of plugins and a large community. Highly customizable and supports various languages and technologies.
Pros:
- Flexible and extensible through plugins
- Supports distributed builds and pipelines
- Large community and extensive documentation
Cons:
- Can be complex to set up and maintain
- Requires manual configuration and setup
Travis CI
![]()
Travis CI is a cloud-based CI/CD platform tightly integrated with GitHub. Focuses on simplicity and ease of use. Offers a free plan for open-source projects.
Pros:
- Easy to set up and use
- Excellent integration with GitHub
- Free for open-source projects
Cons:
- Limited customization options
- Can be less flexible than Jenkins
GitLab CI/CD
![]()
GitLab CI/CD is a built-in CI/CD solution within GitLab, offering a unified experience. Seamlessly integrates with GitLab features like version control, code review, and issue tracking.
Pros:
- Tight integration with GitLab
- Streamlined workflows within a single platform
- Supports containerization and Kubernetes
Cons:
- Limited flexibility for non-GitLab users
- Features tied to GitLab version
Code Performance Monitoring
It delves into code execution times, pinpointing resource-intensive functions and providing actionable insights for developers. This focus on optimization ensures lightning-fast code that delights users.
Benefits:
- Optimized code: Real-time insights into code execution time and resource-intensive functions enable developers to optimize code for better performance.
- Improved user experience: Enhancements in code efficiency directly translate to a more responsive and satisfying user experience.
Example of tools:
New Relic
![]()
New Relic is a comprehensive APM platform with a strong focus on code-level visibility. Offers deep insights into code execution times, transaction traces, and database queries.
Pros:
- Deep code-level visibility
- User-friendly interface
- Extensive integrations with other tools
- Strong support for various languages and frameworks
Cons:
- Can be expensive for large-scale deployments
- May require some manual configuration
AppDynamics
![]()
AppDynamics is a comprehensive APM platform known for its ease of use and business-centric approach. Provides code-level insights along with end-user monitoring and business transaction analysis.
Pros:
- Easy to set up and use
- Clear visualization of performance issues
- Business transaction analysis
- Strong support for multi-cloud environments
Cons:
- Can be less granular in code-level insights compared to New Relic
- Pricing can be complex
Dynatrace
![]()
Dynatrace is a full-stack observability platform that combines APM, infrastructure monitoring, and user experience monitoring. Offers code-level insights as part of its comprehensive approach.
Pros:
- Unified platform for full-stack observability
- AI-powered analysis for automatic root cause detection
- Strong support for cloud-native environments
- Zero-configuration setup
Cons:
- Can be more expensive than other options
- May have a steeper learning curve
Feature rollouts and A/B testing
Observability tracks user interactions and analyzes feature adoption metrics during rollouts and A/B testing, providing invaluable insights to guide decision-making. This allows for rapid adjustments based on real-world user behavior.
Benefits:
- Decision-making: Observability provides data on feature adoption and user behavior, guiding data-driven decisions during A/B testing.
- Risk mitigation: Swift rollback capabilities allow teams to address issues promptly, minimizing any negative impact on user experience.
Useful tools:
LaunchDarkly
![]()
LaunchDarkly is a feature management platform specializing in feature flag management and experimentation. It enables organizations to control feature releases, target users, and experiment with different versions of features.
Pros:
- Deep code-level
- Comprehensive feature flag management
- Strong experimentation capabilities
- User segmentation and targeting
- Robust security and compliance features
- User-friendly interface
Cons:
- Can be expensive for large-scale deployments
- Limited A/B testing capabilities compared to dedicated experiment platforms
Split.io
![]()
Split.io is a feature management and experimentation platform with a strong focus on A/B testing and data-driven decision-making. It provides advanced experiment management features, statistical analysis, and integrations with analytics tools
Pros:
- Powerful A/B testing capabilities
- Advanced experiment design and analysis
- Integration with analytics tools
- Flexible pricing plans
Cons:
- Feature flag management may not be as comprehensive as LaunchDarkly
- User interface can be less intuitive
Optimizely
![]()
Optimizely is a web experimentation platform primarily for A/B testing and personalization. It offers a visual editor for creating experiments, real-time results, and integrations with various marketing and analytics tools.
Pros:
- Easy-to-use visual editor for experiment creation
- Real-time results and reporting
- Integration with marketing and analytics tools
- Strong focus on personalization
Cons:
- Limited feature flag management capabilities
- Pricing can be less flexible than other options
Use cases in DevOps
For a more in-depth explanation of observability in DevOps, please refer to our glossary.
Infrastructure monitoring
It provides a real-time view into the health and performance of your infrastructure, enabling you to detect potential issues early and act decisively. It's like having a dedicated team of engineers monitoring your servers 24/7.
Benefits:
- Proactive scaling: Real-time monitoring of server health and performance allows for proactive scaling, ensuring optimal resource allocation based on demand.
- Improved reliability: Timely detection of infrastructure issues minimizes the risk of system downtime, enhancing overall system reliability.
Tools to watch for:
Prometheus
![]()
Prometheus is an open-source time-series database and query language platform focused on collecting and storing metrics from servers and applications. Offers built-in alerting capabilities.
Pros:
- Highly scalable and efficient for storing and querying time-series data.
- Powerful query language (PromQL) for detailed analysis.
- Active community and extensive integrations.
- Lightweight and resource-friendly.
Cons:
- Primarily metric-focused, less suited for event or log monitoring.
- Setup and configuration can be complex for beginners.
- Requires integration with separate visualization tools.
Grafana
![]()
Grafana is an open-source data visualization platform that connects to various data sources, including Prometheus. Build dashboards for continuous observation of infrastructure health.
Pros:
- Powerful visualization capabilities with customizable dashboards.
- Integrates with various data sources
- User-friendly interface for easy monitoring and analysis.
- Supports collaboration and sharing of dashboards.
Cons:
- Security considerations for shared dashboards
- Managing complex dashboards for large environments
- Limited out-of-the-box alerting capabilities
- Advanced features might require learning their respective data source's query language.
Container orchestration
Observability grants visibility into the health and performance of individual containers, enabling you to identify bottlenecks, optimize resource utilization, and ensure the smooth operation of containerized applications.
Benefits:
- Dynamic scaling: Observability facilitates the dynamic scaling of containers in response to changing workloads, optimizing resource utilization.
- Ensured container health: Monitoring container health ensures the stability and efficiency of containerized applications.
List of useful tools:
Kubernetes
![]()
Kubernetes is an open-source, industry-standard platform for managing containerized workloads across a cluster of machines. Offers comprehensive observability features through cluster metrics, logs, and tracing.
Pros:
- Highly customizable and scalable.
- Extensive community and ecosystem of tools and plugins.
- Strong security and RBAC features.
Cons:
- Steeper learning curve compared to simpler tools.
- Requires additional infrastructure and configuration.
- Can be complex for smaller deployments.
Docker Swarm
![]()
Docker Swarm is a built-in container orchestration engine within Docker. Offers basic features for deploying and managing containerized applications.
Pros:
- Easy to set up and use, especially for existing Docker users.
- Lightweight and less resource-intensive than Kubernetes.
- Suitable for smaller deployments or microservices.
Cons:
- Less flexible and scalable than Kubernetes.
- Limited feature set and ecosystem compared to Kubernetes.
- Can be challenging to manage for larger deployments.
Amazon ECS
![]()
Amazon ECS is a managed container orchestration service offered by AWS, providing a simple and scalable solution for running containerized applications on the cloud.
Pros:
- Fully managed service with minimal setup and maintenance.
- Seamless integration with other AWS services like CloudWatch and CloudTrail for container monitoring and logging.
- Simple scaling and resource management.
Cons:
- Vendor lock-in to AWS ecosystem.
- Less customization and flexibility compared to open-source tools.
- Can be expensive for larger deployments.
Microservices architecture
It traces communication pathways between microservices, providing insights into dependencies and potential bottlenecks. It's like having a GPS for your distributed system.
Benefits:
- Efficient communication: Tracing communication between microservices helps identify and rectify potential bottlenecks, improving overall system efficiency.
- Enhanced scalability: Observability aids in managing the complexity of distributed systems, making it easier to scale microservices as needed.
Tools examples:
Jaeger
![]()
Jaeger is an open-source, distributed tracing platform that tracks and analyzes requests across microservices. Widely used for its flexibility and integration with various platforms.
Pros:
- Comprehensive tracing data for detailed analysis
- Supports multiple languages and frameworks
- Integrates with popular monitoring tools like Prometheus and Grafana
- Open-source and customizable
Cons:
- Can be complex to set up and configure for large deployments
- Requires additional collectors and agents for distributed tracing
Zipkin
![]()
Zipkin is an open-source tracing system initially developed by X, ex Twitter. Provides basic visualizations and analysis of microservice interactions.
Pros:
- Easy to set up and use, especially for smaller deployments
- Widely adopted and documented community
- Integrates with various platforms and languages
Cons:
- Less feature-rich than Jaeger, limited scalability and customization
- Primarily focuses on basic tracing functionality
OpenTelemetry
![]()
OpenTelemetry is an emerging vendor-neutral set of APIs and SDKs for collecting and exporting observability data. Aims to unify how tracing, metrics, and logs are collected and sent to various backend tools.
Pros:
- Standardized instrumentation for various technologies
- Supports multiple tracing backends like Jaeger and Zipkin
- Provides a future-proof solution for evolving microservices landscapes
Cons:
- Still under development, may require additional integrations for specific tools
- Requires understanding of different tracing backends and their configuration
Use cases in software engineering
Debugging and troubleshooting
Observability cuts through the mystery of debugging by providing real-time analysis of error logs, tracking system behavior, and offering insightful clues for swift resolution. It's like having a detective on your team, always on the lookout for anomalies.
Benefits:
- Reduced Mean Time to Resolution (MTTR): Swift identification and resolution of software bugs reduce the time it takes to address issues, minimizing downtime.
- Enhanced system stability: Real-time analysis of error logs ensures the stability of the software system.
List of tools:
Sentry
![]()
Sentry is a cloud-based error tracking and performance monitoring platform. Captures errors and events, prioritizes them based on impact, and provides detailed insights for efficient debugging.
Pros:
- User-friendly interface for easy navigation and analysis
- Robust error grouping and prioritization
- Integration with popular tools and frameworks
- Advanced features like release tracking and performance monitoring
Cons:
- Can be expensive for large-scale deployments
- Reliance on cloud-based infrastructure
- Limited customization for specific needs.
Raygun
![]()
Raygun is a cloud-based error monitoring and crash reporting platform. Focuses on real-time error detection, user experience insights, and crash reporting for mobile apps.
Pros:
- Strong emphasis on mobile app crash reporting
- User session recordings for reproducing errors
- Real-time user insights for understanding user behavior
- Integration with issue tracking tools like Jira
Cons:
- Limited customization options
- Cost concerns for large-scale deployments
- Primarily focused on mobile app monitoring
Bugsnag
![]()
Bugsnag is a cloud-based error monitoring and reporting platform with a focus on actionable insights and integrations. Provides comprehensive error analysis, prioritization, and integration with issue-tracking tools.
Pros:
- Clear error prioritization and actionable insights
- Integration with issue tracking tools for streamlined workflows
- Customizable workflows and notifications
- Support for various platforms and languages
Cons:
- Limited free plan for smaller projects
- Can be expensive for larger teams
- Reliance on external cloud service
Performance optimization
Observability shines a light on resource utilization, identifying bottlenecks, and guiding optimization efforts. Think about it like having a performance coach for your application.
Benefits:
- Resource efficiency: Observability tools help identify and rectify performance bottlenecks, leading to more efficient use of resources.
- Improved user satisfaction: Optimizing application response time directly contributes to a positive user experience.
Tools that can be useful:
Datadog
![]()
Datadog is a comprehensive cloud-based monitoring platform offering metrics, logs, tracing, and application performance monitoring (APM).
Pros:
- Deep insights into application performance with code-level visibility
- Detailed resource utilization analysis and bottleneck identification
- User-friendly interface with customizable dashboards and alerts
- Integration with various tools and frameworks
- Powerful analytics and reporting capabilities
Cons:
- Can be expensive for large-scale deployments
- Initial setup might require some technical expertise
- Potential vendor lock-in with cloud service
ELK Stack (Elasticsearch, Logstash, Kibana)
![]()
ELK Stack is an open-source stack combining Elasticsearch (search engine), Logstash (data processing pipeline), and Kibana (visualization dashboard). Offers log management and analysis for performance insights.
Pros:
- Highly flexible and customizable for diverse needs
- Powerful data analysis and filtering capabilities
- User-friendly Kibana interface for visualizing performance metrics
- Large community and open-source ecosystem
Cons:
- Requires technical expertise for setup and configuration
- Can be resource-intensive for large datasets
Splunk
![]()
Splunk is an enterprise-grade platform for log management, analysis, and security. Offers detailed performance insights through log analysis and machine learning.
Pros:
- Robust log management and analysis features
- Powerful search and correlation capabilities
- Machine learning for anomaly detection and performance optimization
- Extensive integrations with various tools and platforms
Cons:
- Can be expensive for large deployments
- Complex setup and configuration
User experience monitoring
Observability tracks user interactions, providing insights into user behavior and enabling engineers to identify and address UI/UX issues that hinder satisfaction. The analogy is having a focus group built into your software.
Benefits:
- Enhanced usability: Monitoring user interactions helps identify and address UI/UX issues, ensuring a seamless and enjoyable user experience.
- User-centric development: Observability fosters a user-centric approach by providing insights into how users interact with the software.
Try these tools:
FullStory
![]()
FullStory is a powerful tool that records user sessions, providing visual replays and heatmaps of user interactions. Offers insights into how users navigate, click, and engage with your interface.
Pros:
- Detailed session recordings for in-depth analysis of user behavior
- Heatmaps highlight areas of user focus and potential bottlenecks
- User feedback capture and sentiment analysis
- A/B testing capabilities for optimizing UI elements
Cons:
- Can be resource-intensive for large websites
- Potential privacy concerns for extensive session recordings
- Requires some technical expertise for analysis.
UserTesting
![]()
UserTesting is an online platform for conducting user testing and receiving feedback from real users. Allows you to recruit and test prototypes, websites, and mobile apps on real devices.
Pros:
- Access to a diverse pool of testers for realistic feedback
- Unmoderated video recordings capturing user expressions and reactions
- Detailed written reports with user insights and recommendations
- Easy-to-use interface for setting up and running tests
Cons:
- Costs associated with recruiting and paying testers
- Limited quantitative data compared to session recordings and heatmaps
Hotjar
![]()
Hotjar is a lightweight tool that provides heatmaps, recordings, and user polls to understand user behavior. Offers insights into clicks, scrolls, form fills, and attention hotspots.
Pros:
- Easy to set up and use with minimal code implementation
- Affordable even for small websites and budgets
- Visual heatmaps and recordings for quick identification of user frustrations
- User polls for gathering direct feedback on specific aspects of the UI
Cons:
- Primarily focuses on visual data analysis can be overwhelming for complex websites,
- Basic A/B testing capabilities.
Wrap up
In a world where software is the lifeblood of organizations, observability is no longer a luxury, but a necessity. By embracing its power, we can unlock a future of resilient software from infrastructure health to user interactions, from performance metrics to error logs. Hope this article will help you dive into the world of observability and find the right tools for your software to soar to new heights.
Ready to see your software reach its full potential? Contact Mad Devs today for a free consultation and let's chat about how we can an approach to software development that prioritizes resilience and adaptability.


FAQ
What is an observability tool?
What is the difference between monitoring tools and observability tools?
What are the three pillars of observability?
How to choose the right observability tool?
Latest articles here