

Analyze with AI
Get AI-powered insights from this Mad Devs article:
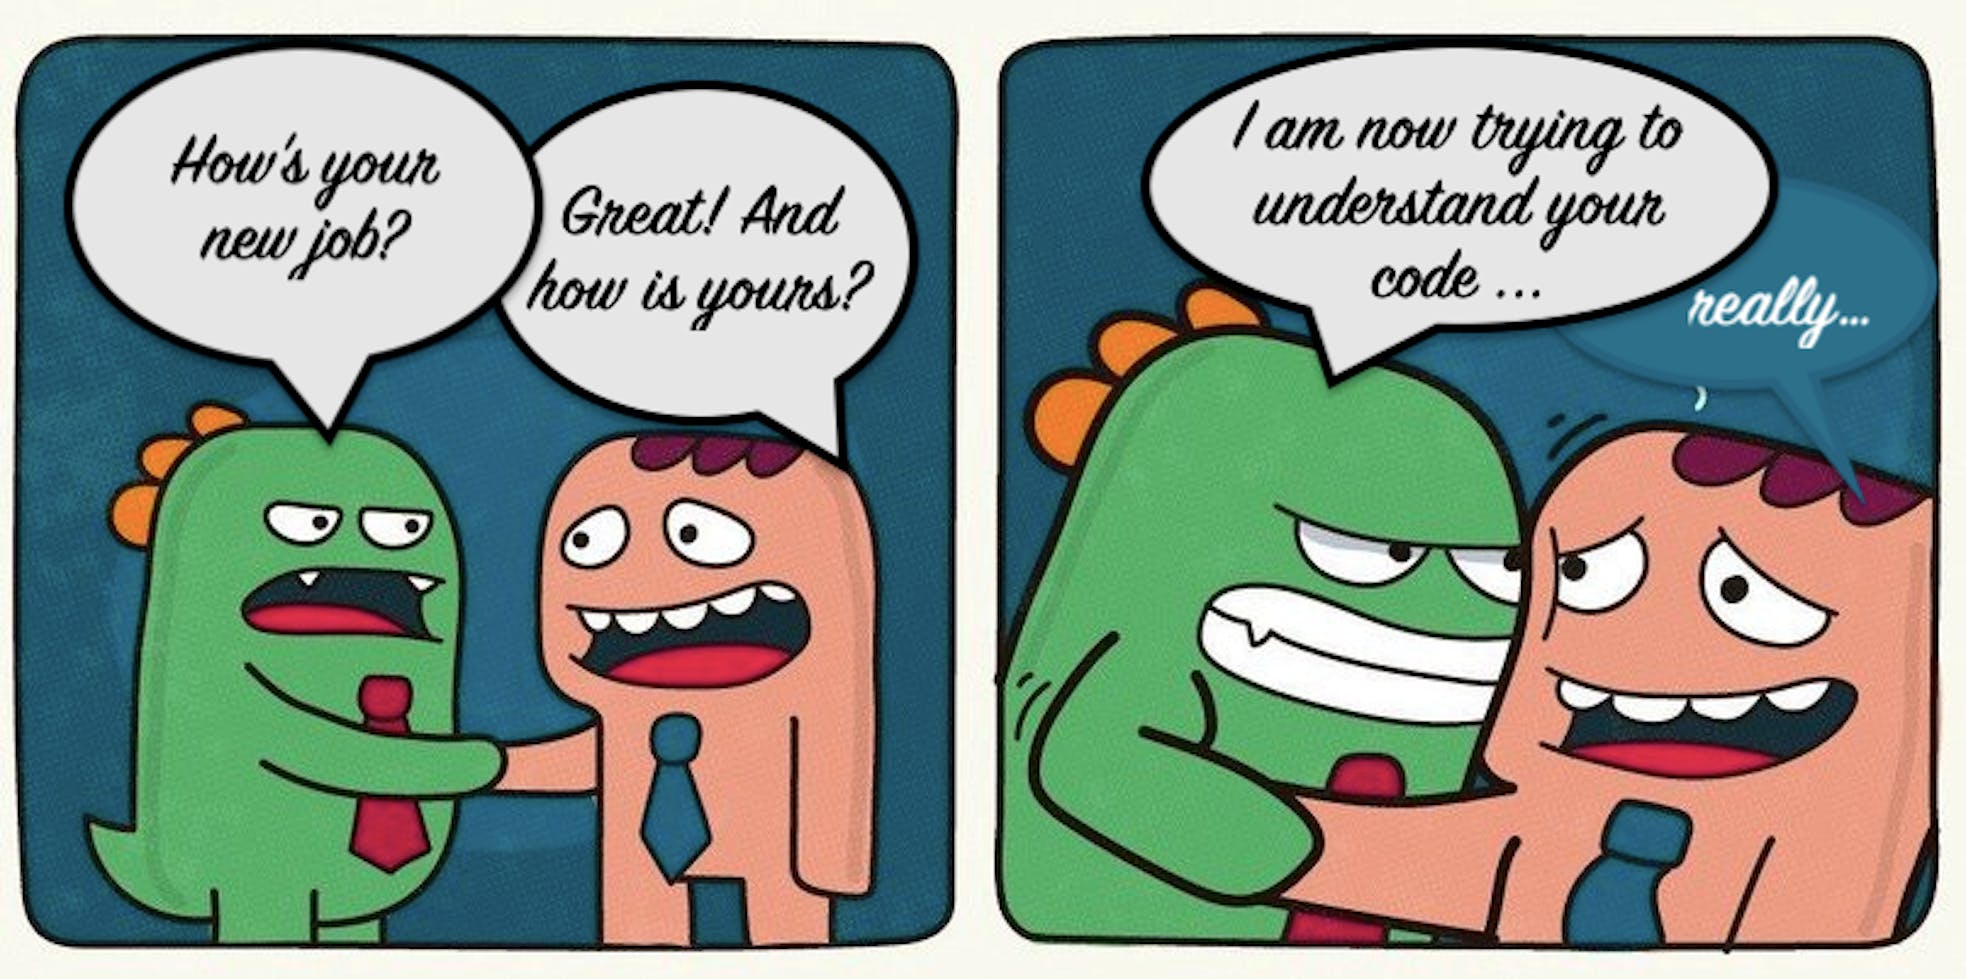
Everyone who writes code knows that the best code is code that is not written! But as they say, everyone is not perfect, and we have to write code. But how to help improve code, and then monitor the quality of code in your project? This question is constantly asked by people who are not indifferent to the quality of the code. Now, there are many different OSS solutions for analyzing code quality on the market, but in this blog post, I'll tell you about integrating a free and very handy tool! Meet the Code Climate (now Qlty Cloud)!
Because I write code in VSCode using Remote-Containers, I'll tell you how to connect these great tools together and get the benefit from it.
A little background: how did I come to this?
I write code. Linter says: "Everything is fine, don't worry, be happy," and everything seems to be good, but you have a thought in your head: "Linter does not see all problems! Yes, there are some problems with duplication and structure in my code." I'll fix them later, and it calms me down a bit. But in my head, there are questions:
- How difficult is it to understand the code? How confusing is the branching logic of the conditions? Copmlexity
- What is the number of duplicate codes? Duplication
- How well can my code be maintained? Maintainability
I began to search on the Internet for any solutions in the niche of code analysis, but by old memory, I remembered Code Climate and decided to try it. Added my OSS project to the Code Climate dashboard. Previously, I did not have the opportunity to configure code analysis locally, but now I have, and I returned to this idea again.
Well, the result did not keep me waiting, and the repo received the first marker "C" (it is yellowish) since I had 17 places with duplication of the code and 2 code smells. In general, there are the following markers in descending order of code quality: A, B, C, D, F.
Then, after removing the piece of code with "code smell," the project received the quality mark B.
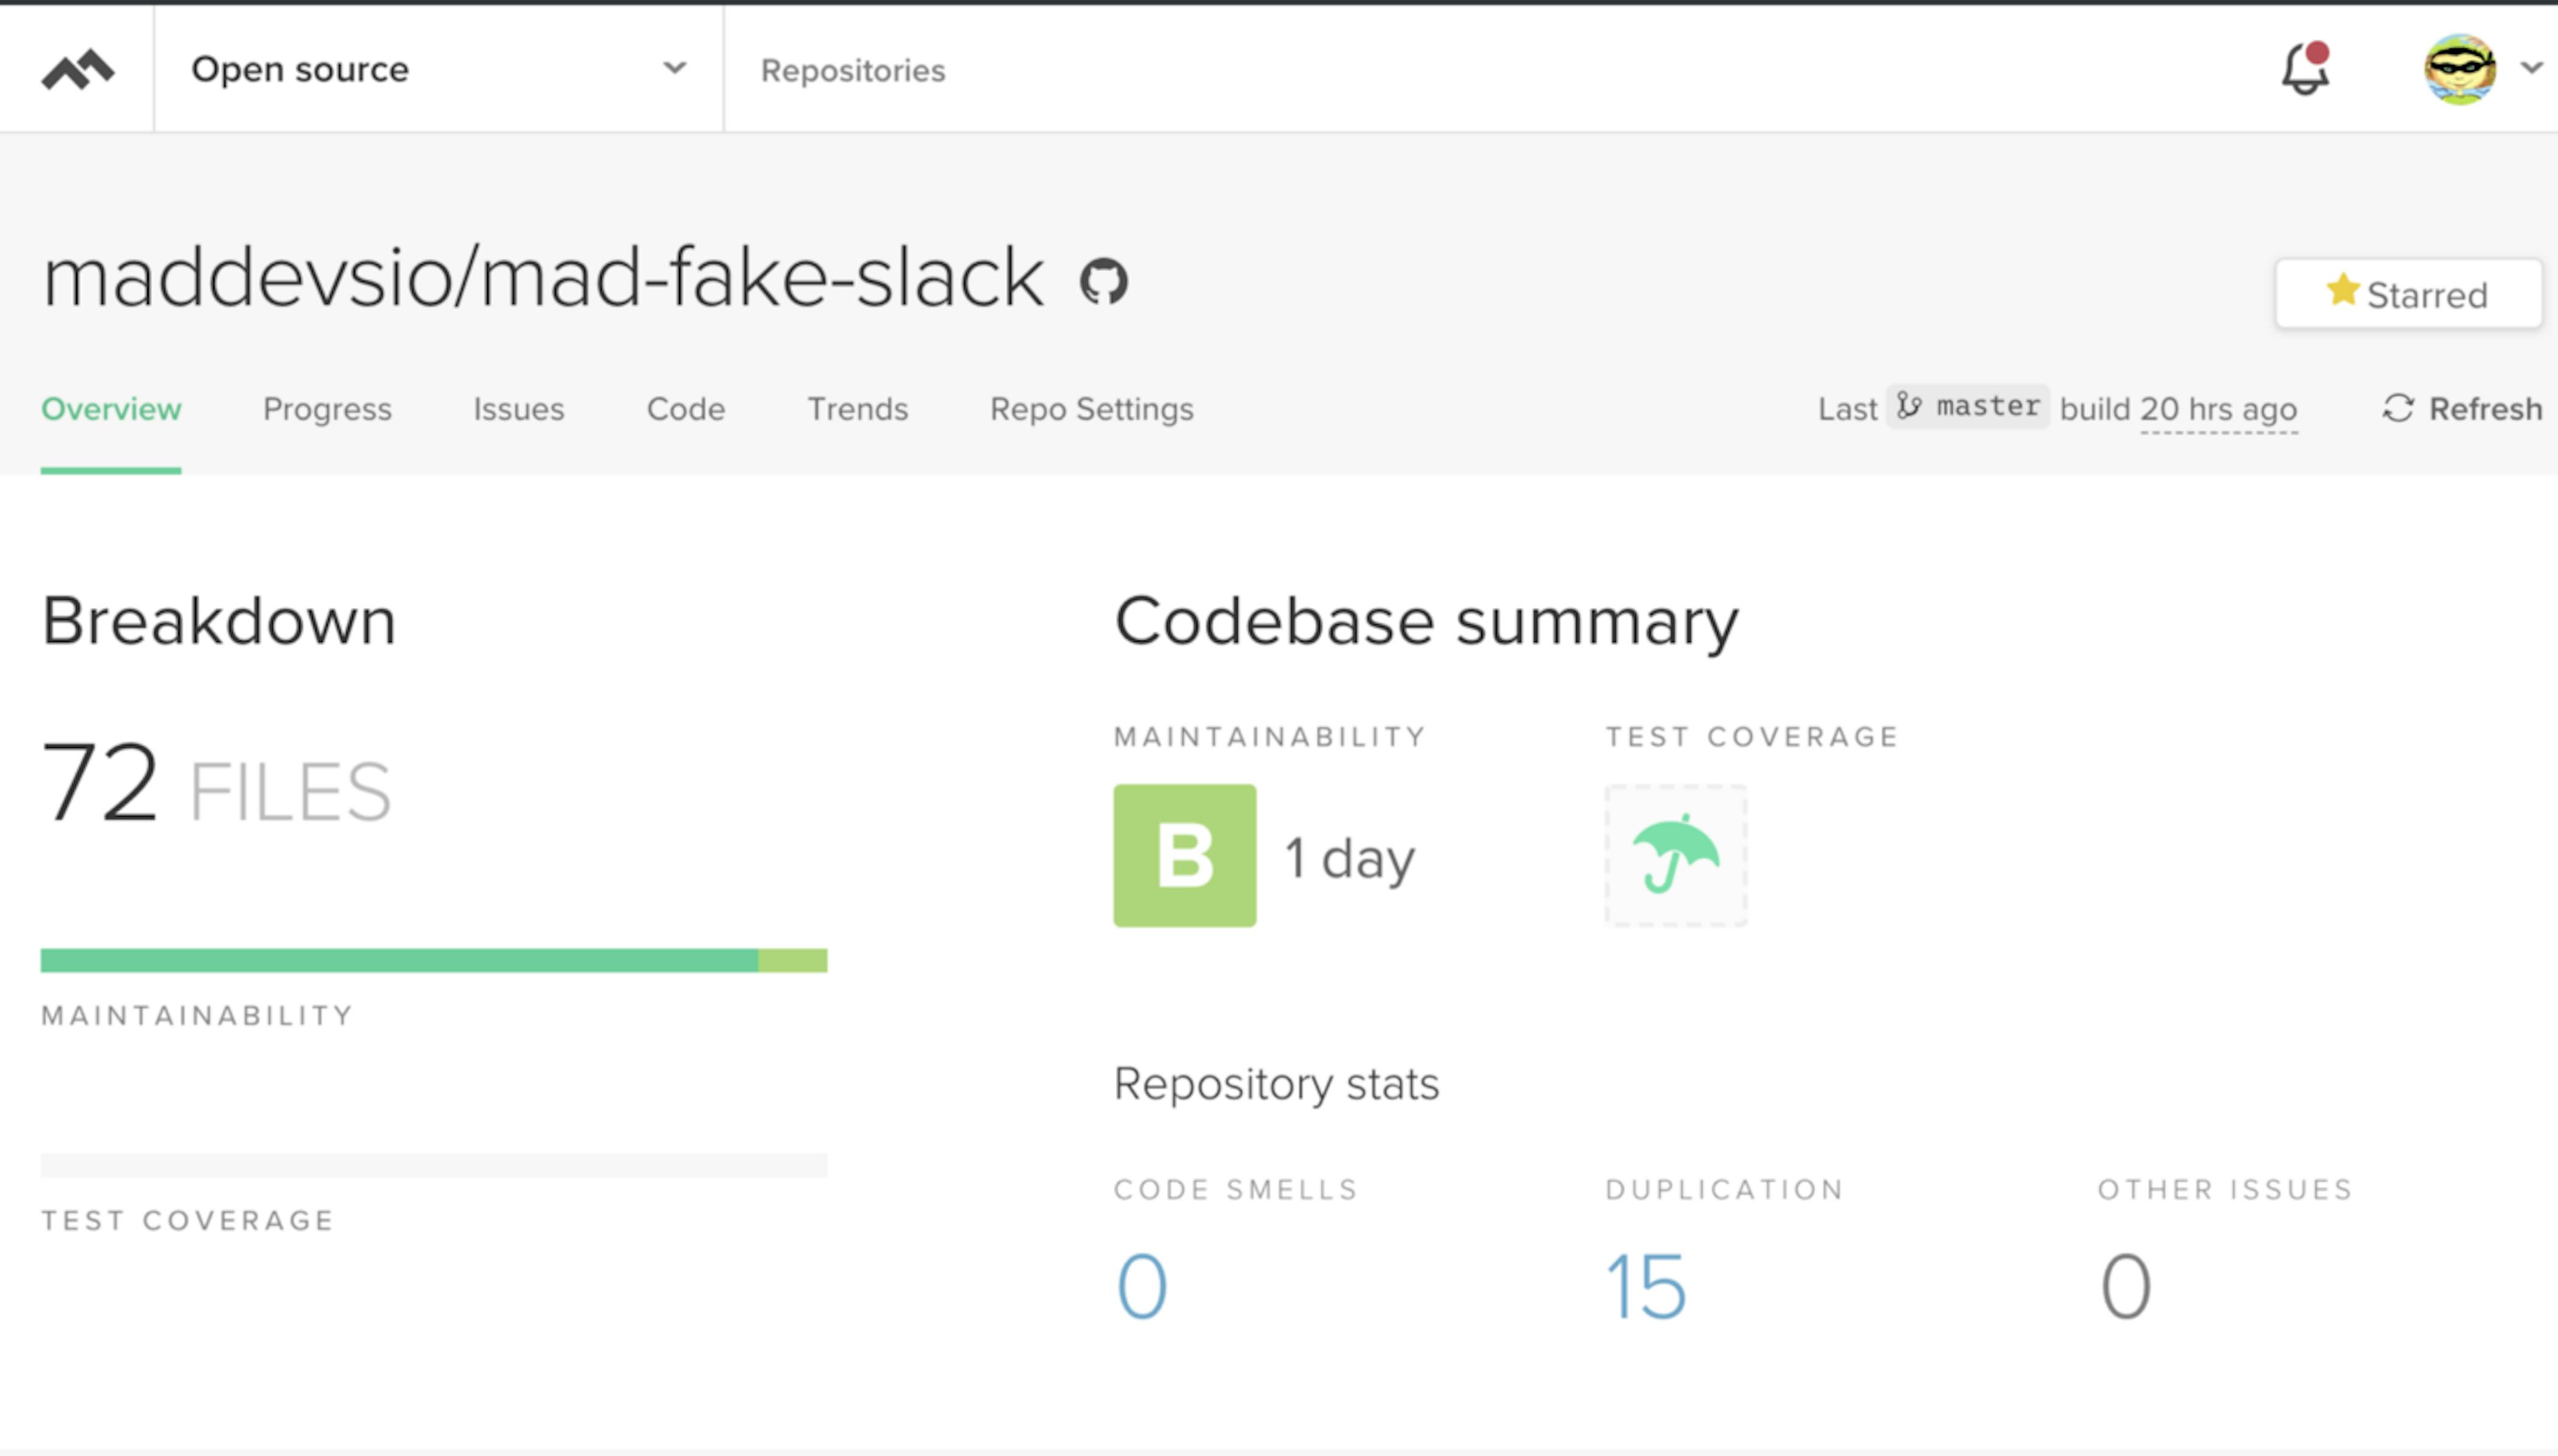
Code Climate gave me an icon with a "B" marker, since I deleted parts of the code with a "smell," but there are still duplications in the code.
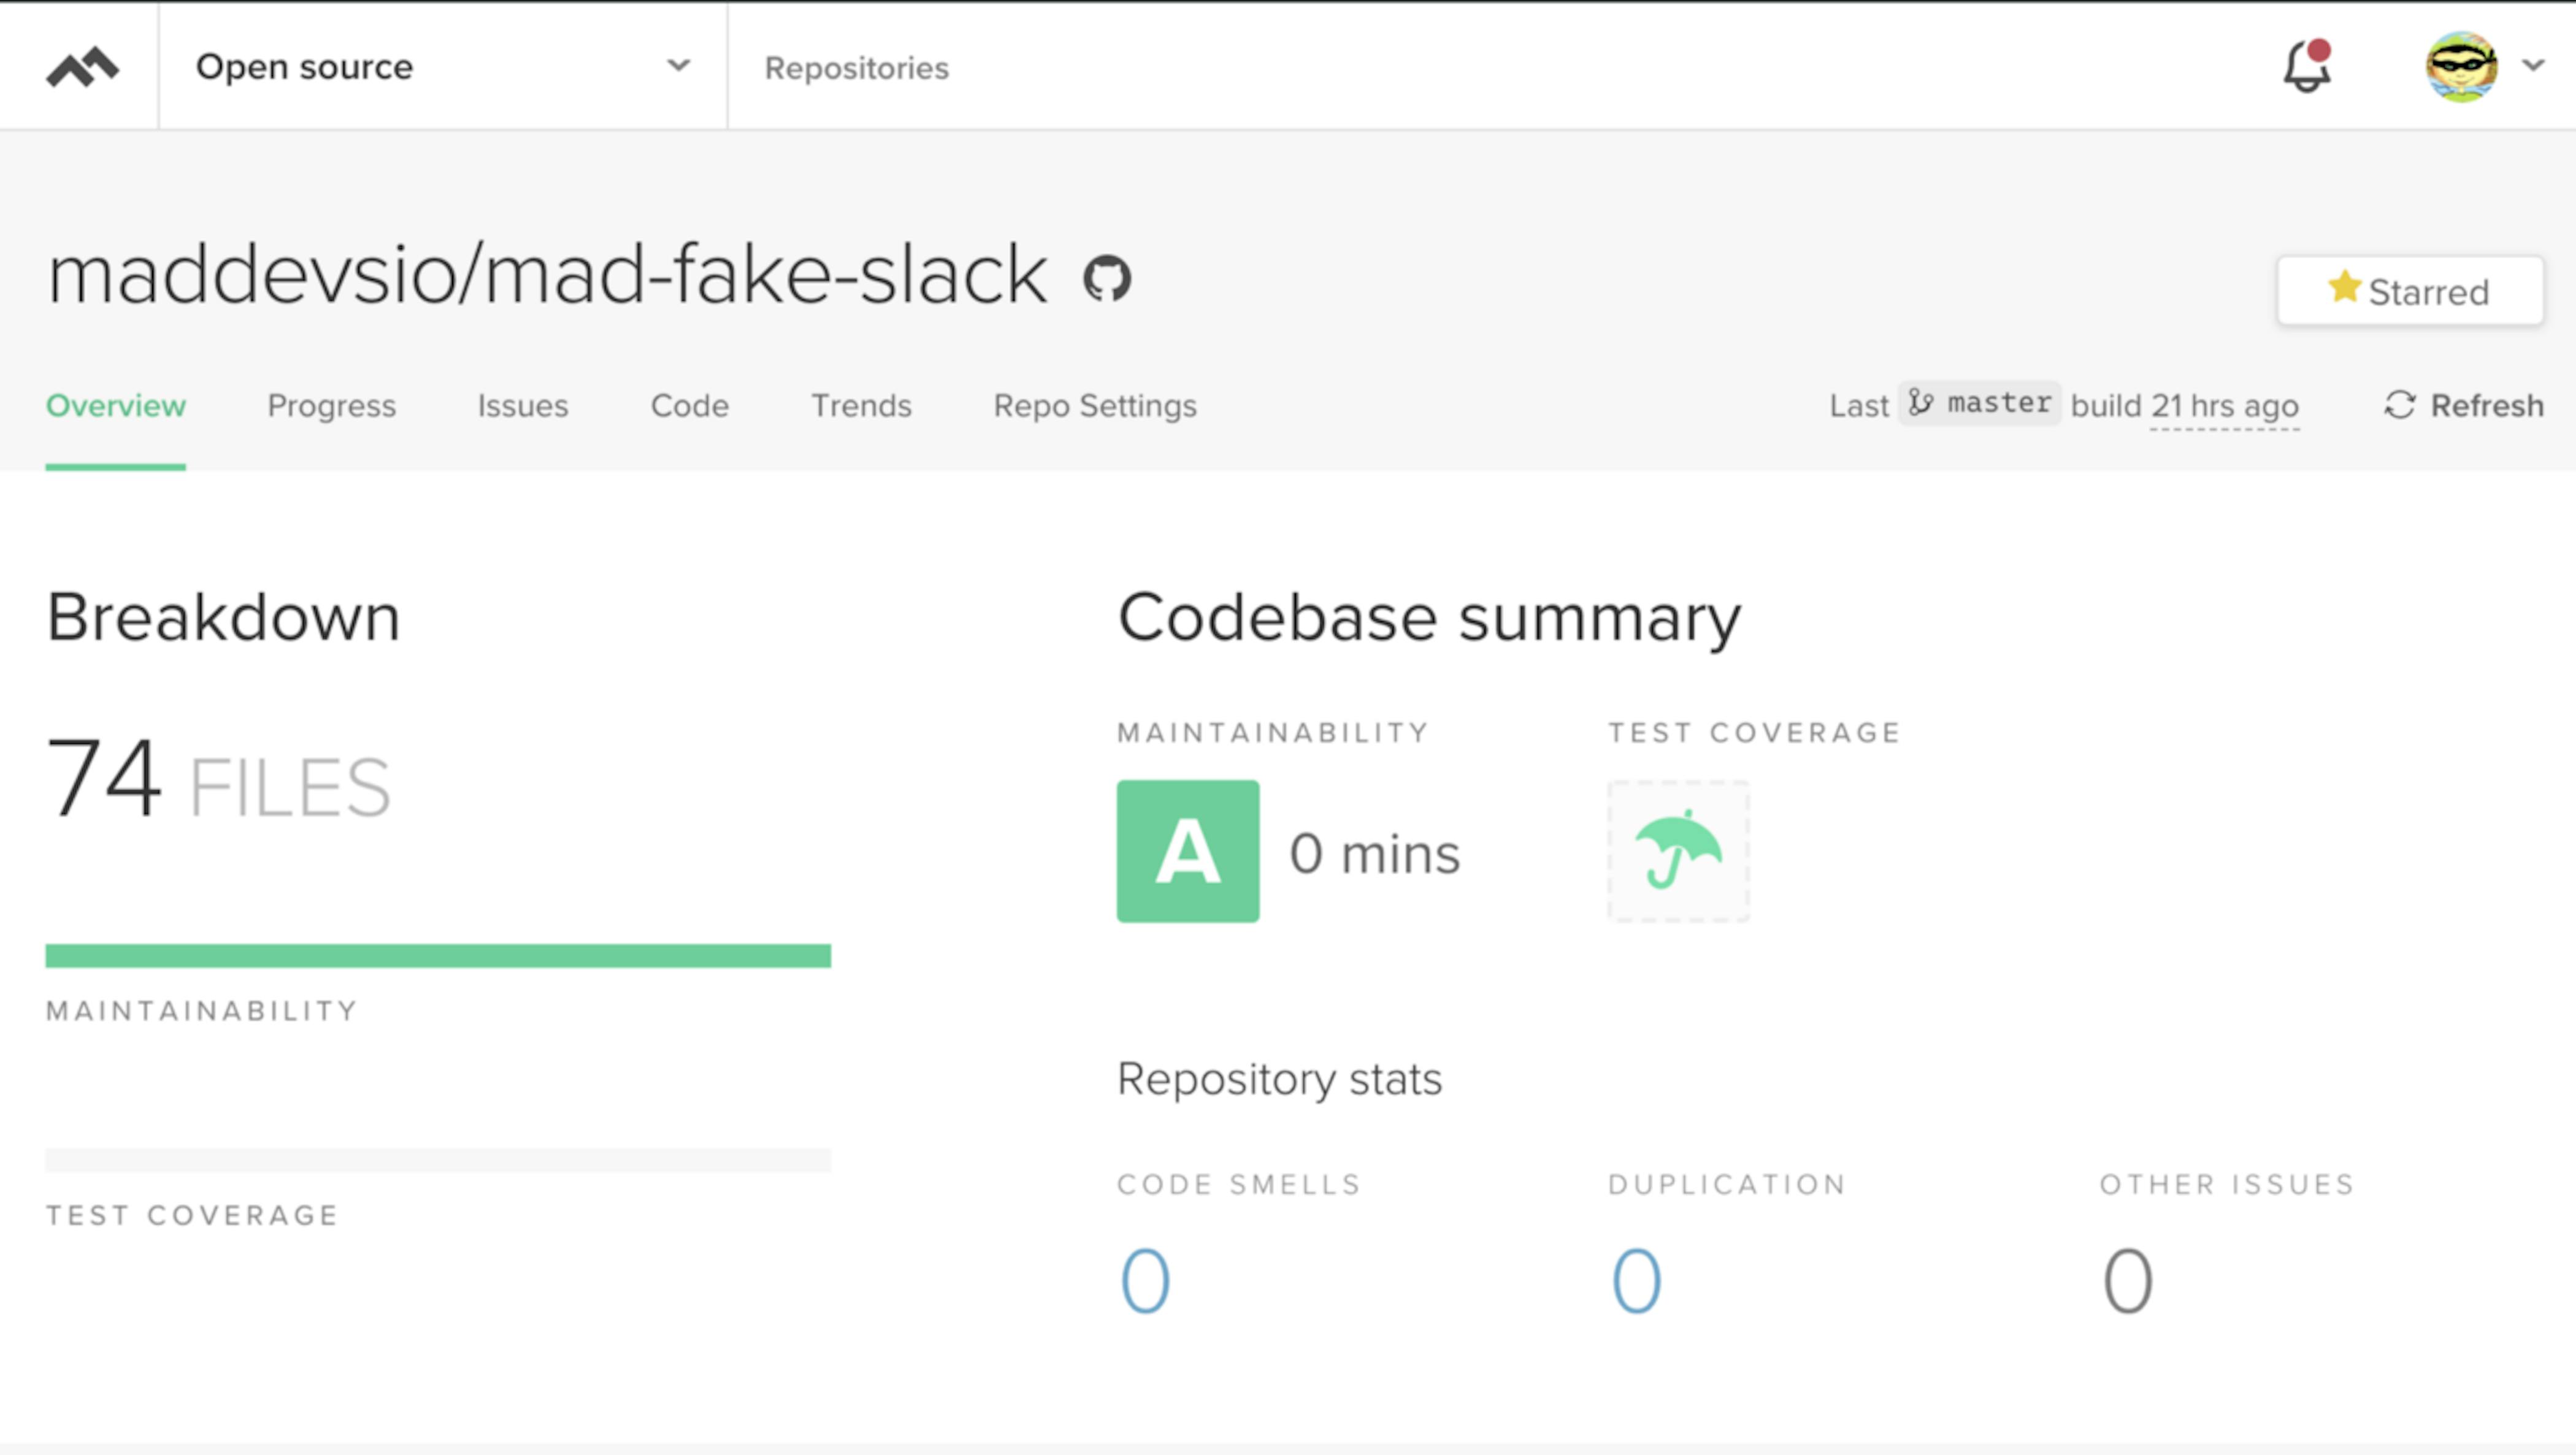
And after refactoring duplicate parts of the code, the project received an A badge.
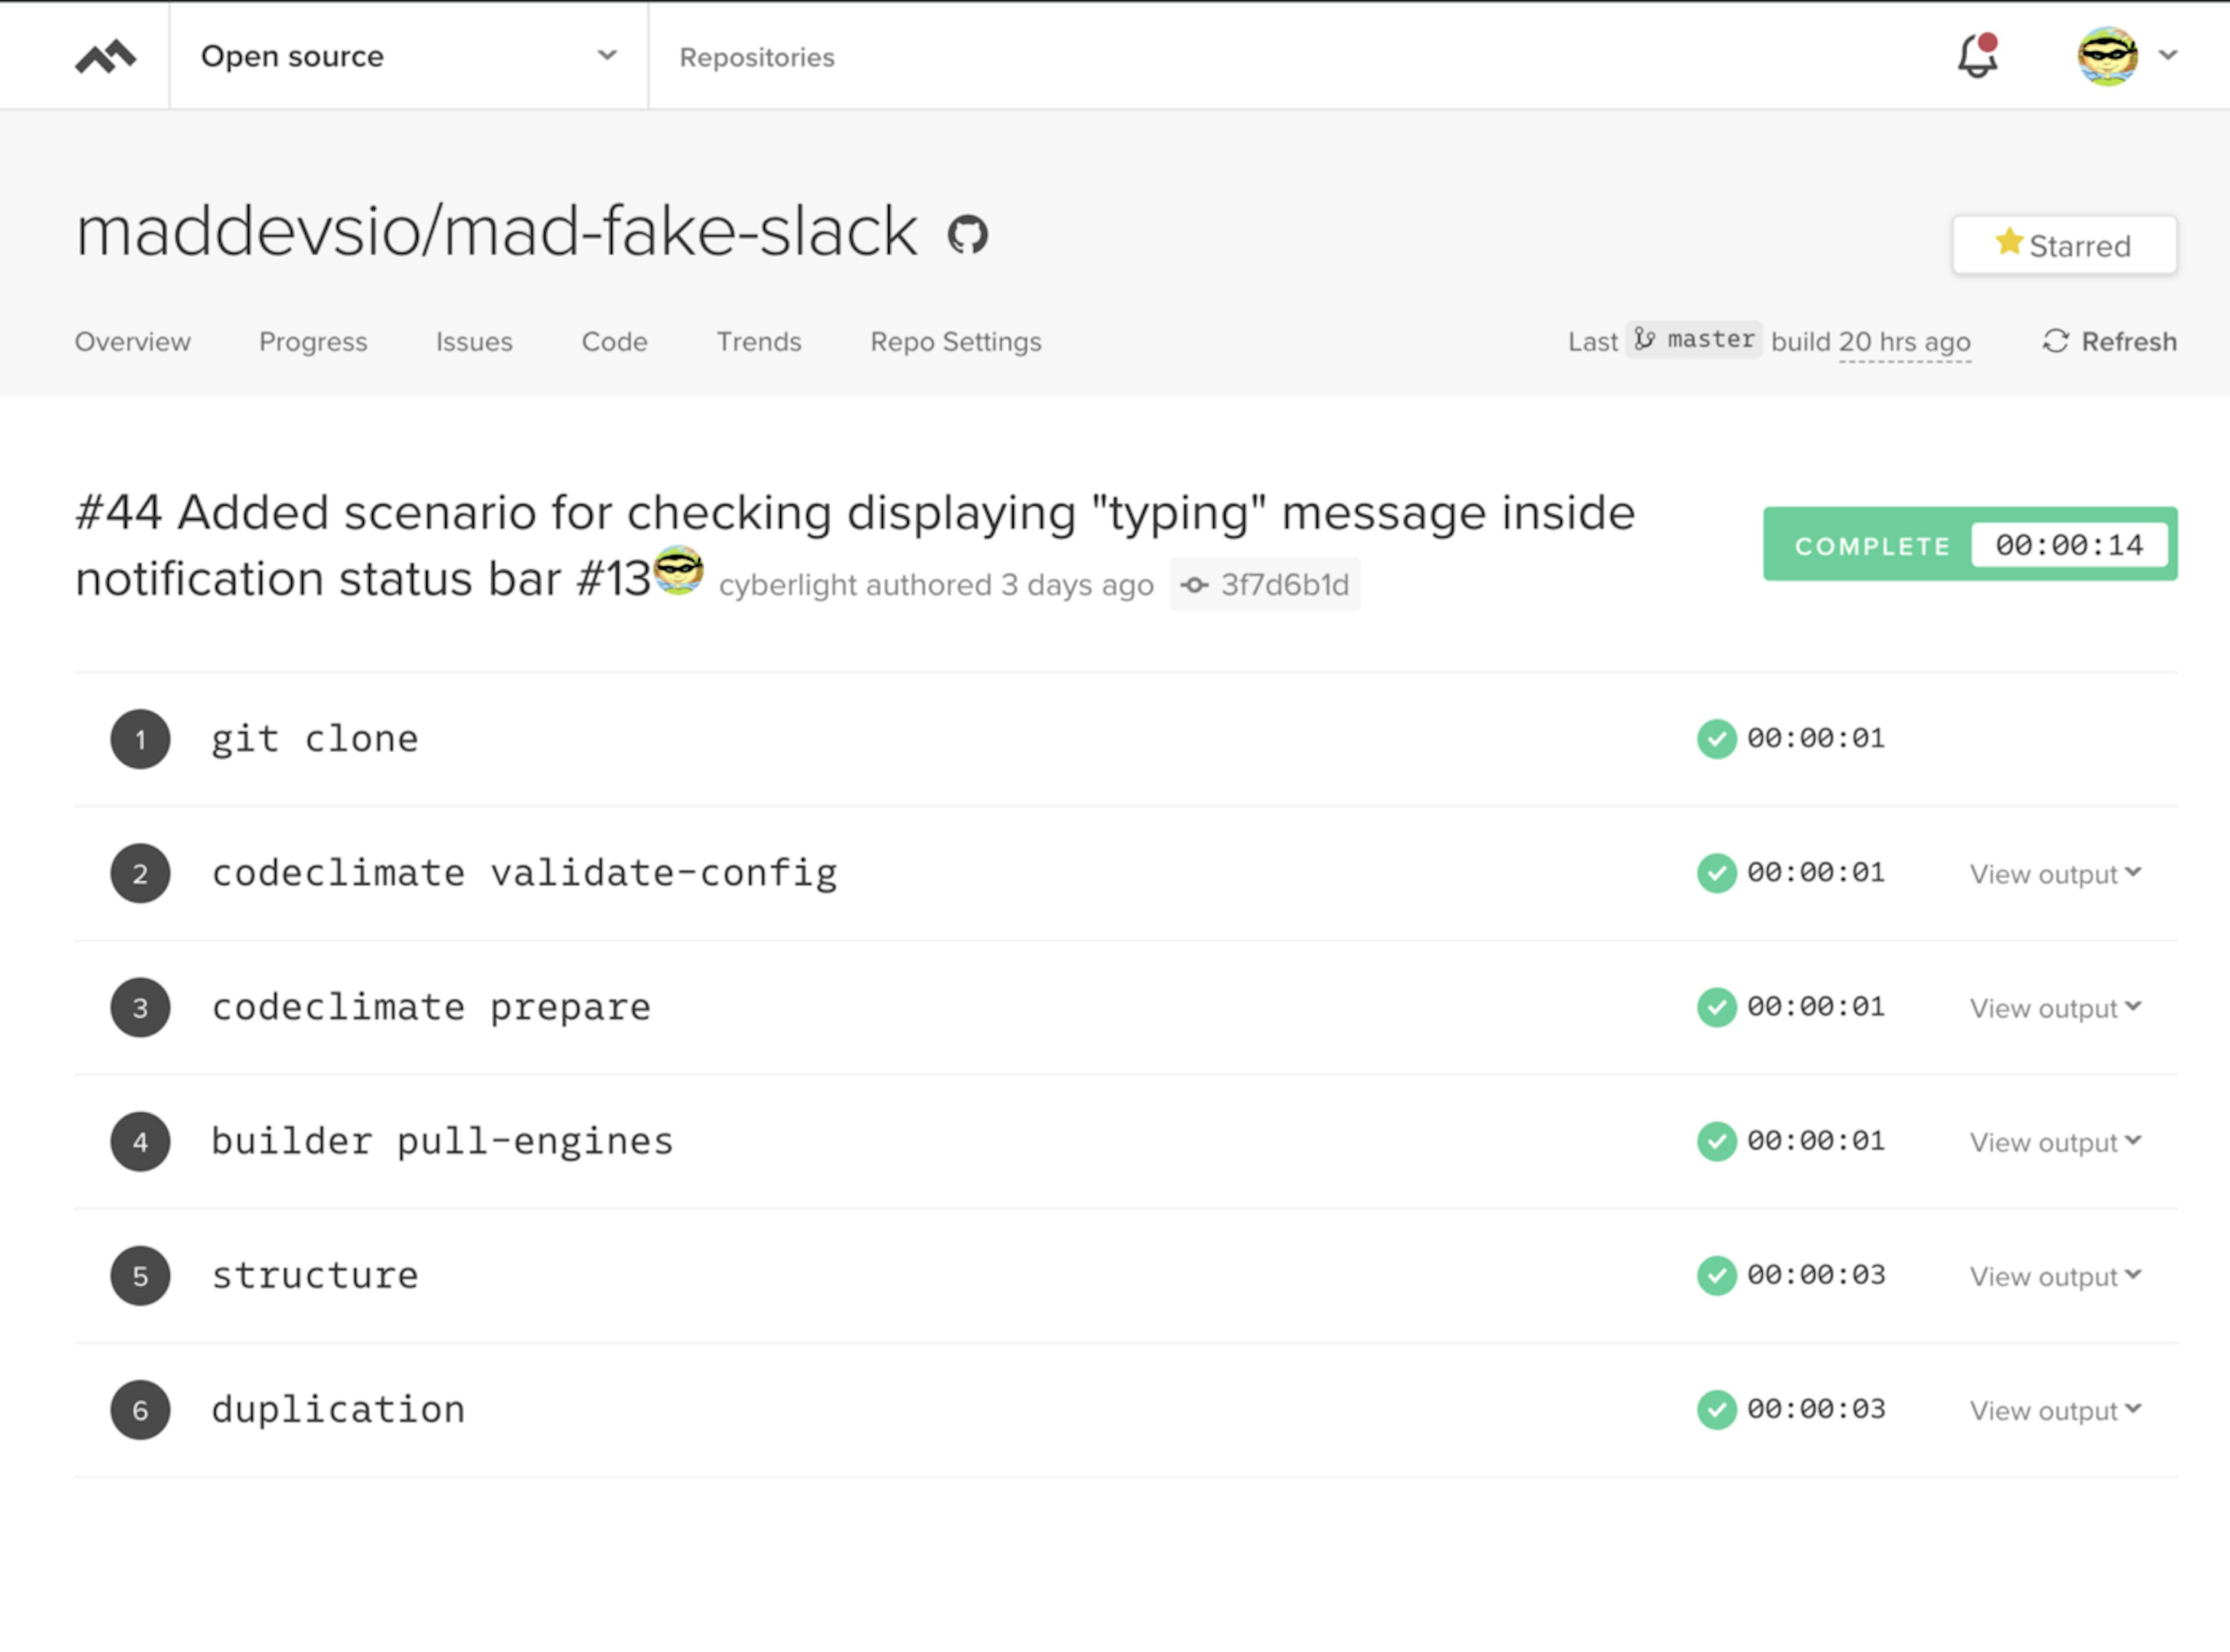
What steps are included in the build process on codeclimate.com?
- Repo cloning
- Validation of your .codeclimate.yml (if it is found in the root of your project). I don't have one, because I've got enough of the default checks.
- Running commands from your .codeclimate.yml, which is inside the prepare block.
- Downloading images of analysis tools by default or from your config.
- Run each analysis tool. in this case structure and duplication. These images are used by default.
Code Climate gave me a report and their mega cool metrics that give your project a symbolic mark denoting the quality of the code.
What surprised?
I was very surprised that for each found problem, the guys calculate the time required for correction. This is very cool! And by the way, the quality marks exactly based on the total time for fixing problems. In a project with a large number of lines of code, the time for fixing problems may increase, and the quality may decrease to F. As soon as possible, you should start measuring the quality of your code and correct the situation, not bringing it to the point of absurdity (when all your work can be discarded and you need to write everything from scratch).
How to add a codeclimate icon to your repo?
Here is the page for getting a badge
Go to your repository page on CodeClimate -> Repo Settings -> Badges.
Key quality parameters used by CodeClimate
- Churn — after finishing analyzing your default branch, you will see churn metrics for the files in your repository. This churn metric is approximately the number of times a file has changed in the last 90 days, calculated by counting the number of distinct versions of that file across commits from that time. Quality issues can have a greater impact on files that churn frequently, so high churn, low quality files should be top candidates for attention.
- Cognitive Complexity — is a measure of how difficult a unit of code is to intuitively understand. Unlike Cyclomatic Complexity, which determines how difficult your code will be to test, Cognitive Complexity tells you how difficult your code will be to read and understand.
- Cyclomatic Complexity — sometimes referred to as McCabe's complexity is a count of the linearly independent paths through source code. You can also think of this more simply as "the number of decisions a given block of code needs to make."
- Duplication — a sequence of source code that occurs more than once, either within a program or across different programs owned or maintained by the same entity. Duplicate code is generally considered undesirable for a number of reasons. A minimum requirement is usually applied to the quantity of code that must appear in a sequence for it to be considered duplicate rather than coincidentally similar. Sequences of duplicate code are sometimes known as code clones or just clones. The automated process of finding duplications in source code is called clone detection.
- Maintainability — is an estimate of technical debt in the repo based on a standardized 10-point assessment of Duplication, Cyclomatic Complexity, Cognitive Complexity, and structural issues.
What languages are supported?
The following languages are supported:
- Ruby
- Python
- PHP
- JavaScript
- Java
- TypeScript
- GoLang
- Swift
- Scala
- Kotlin
- C#
Pretty impressive list! Well done, guys! All popular languages are represented here.
Service is good, but local code analysis is a better way
Linter for IDE was created to help, not punish. In the same sense, you need an assistant who can tell you about your problems in the code in the context of structure and duplication from the other side.
As is well known, such checks are not simple and expensive in terms of resources and time; they cannot be launched as often as a linter (practically on the fly). As for really good analysis, you need to view not one line and not one file, but the entire project.
And for this purpose, it is possible to run CodeClimate locally in Docker for your project.
Since I am developing in VSCode + Remote-Containers, it is not difficult.
The CodeClimate service locally is real!
Below, step by step, will be considered the process of starting the CodeClimate service locally in an ensemble with VSCode.
Preparation
Code Сlimate has one drawback — these are the structure and duplication tools for Docker images.
Each of these images weighs ~1.9 gigabytes in compressed form, and when unpacked, they take 5 gigabytes each. At first, I was scared of the image sizes, but the Docker images are being reused, so there is nothing to be afraid of. And all tools launched as temporary containers. Many complain that it would be great to divide the images by language, but so far, all the analysis tools are gathered together.
So, first of all, you should think about free space on your hard drive.
To download images, you must run the following commands on your host machine:
GitHub Gist is loading...
And do not worry! The most important thing is to execute these commands in turn! After downloading the first image of the codeclimate-structure, you download 1.9 GB (you know that Docker is layered), which means that when you download codeclimate-duplication, you will have the missing layers downloaded, which generally will take ~ 100–200 MB, which is very nice. In reality, it turns out you do not download 4 GB from the Internet, only ~2 GB in total. Next, download the CodeClimate image, and this is the first stage of preparation.
Configure the .devcontainer folder
We need to change the Dockerfile, since we need to put the Docker client in Docker, and also add the settings to the runArgs of the devcontainer.json file.
Let's start with .devcontainer/Dockerfile and add the installation instructions of the Docker client.
GitHub Gist is loading...
General view of the Docker file after adding a step for installing Docker CE — you can have a look here.
Now we need to add access to the Docker daemon (which is running on our host machine) from our VSCode development container. This is done by forwarding a socket as a volume from the host machine to the VSCode Docker container for development. You need to add the following setting in runArgs — the parameter inside the .devcontainer/devcontainer.json file.
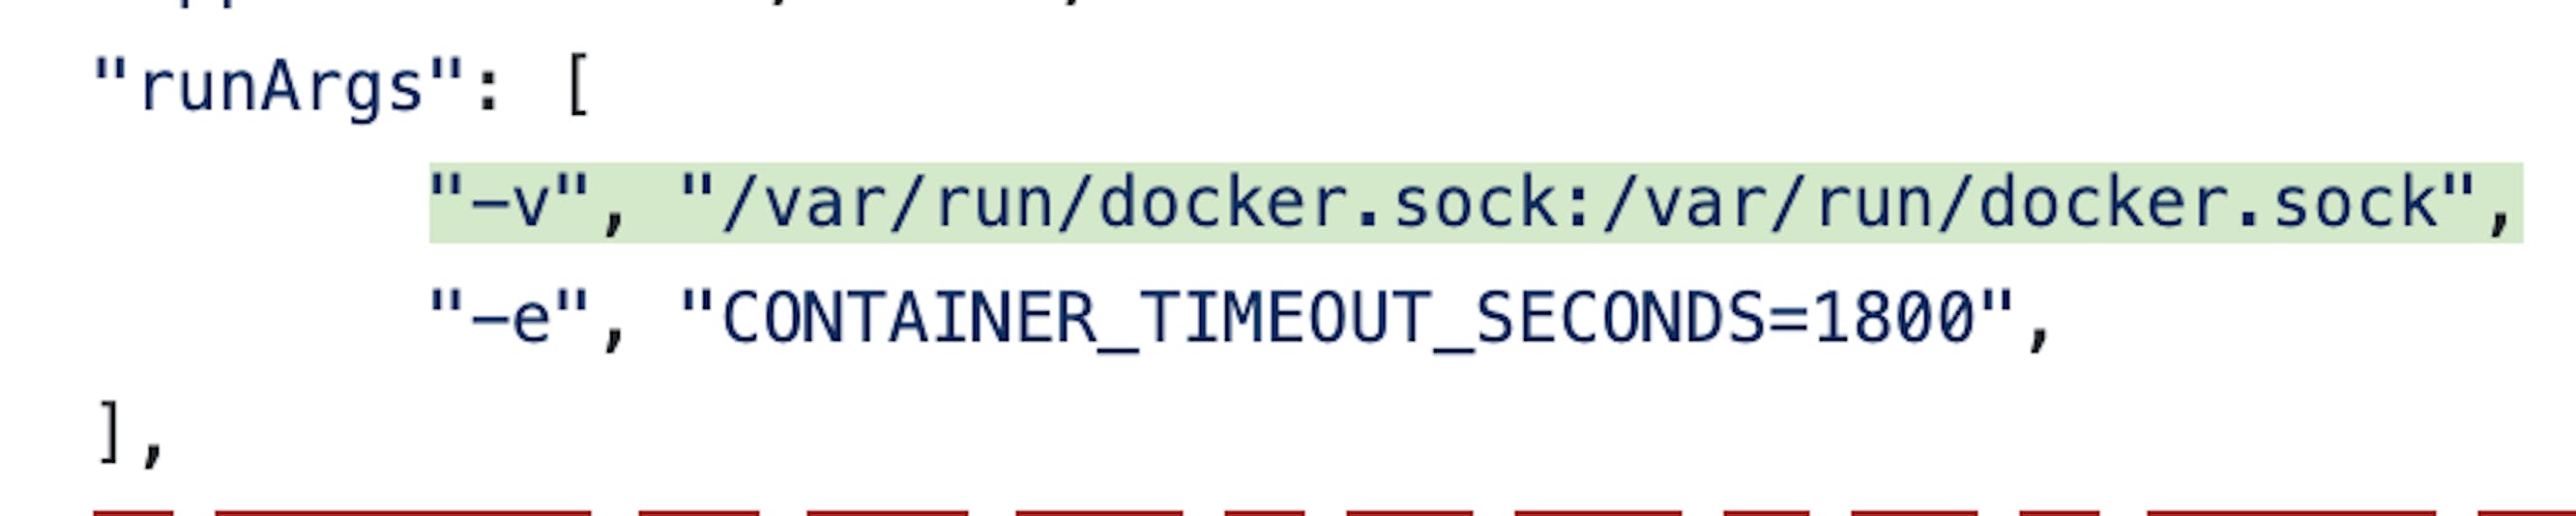
Setting launch options for VSCode development container via Remote-Containers
You can also immediately specify the environment variable CONTAINER_TIMEOUT_SECONDS = 1800, as it is necessary to increase the time during which any of the codeclimate tools can work
Next, you need to specify the command to install and configure the codeclimate wrapper, after creating our VSCode container.
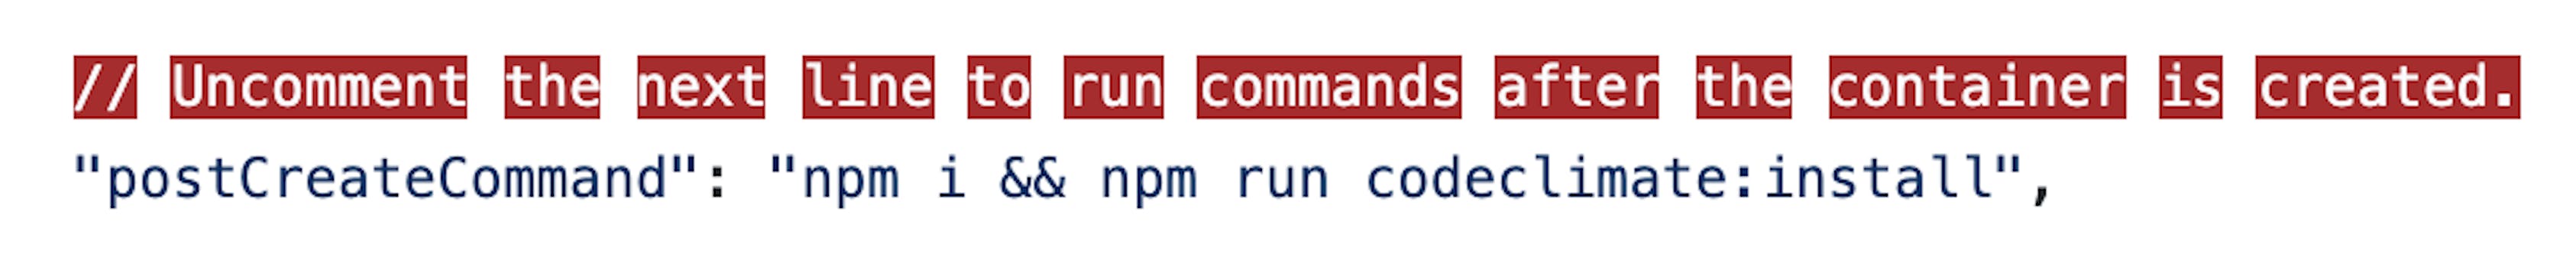
Use the postCreateCommand key to execute commands on the already running VsCode container
These commands need to be executed after the VSCode container is created, since, during the installation, you will need access to the Docker daemon through sockets, which will not be available at the build stage.
The full version of .devcontainer/devcontainer.json can be seen here.
Installing the CodeClimate wrapper into a container
First, you need to write a command that will help install the CodeClimate wrapper.
I added a scripts folder in which I put everything I needed.
In this folder, there is a script for installing a wrapper:
GitHub Gist is loading...
But before you run this script, you need to check that the system contains CodeClimate images; otherwise, the installation process will be delayed for N minutes or hours, depending on the speed of the Internet. Since I once again remind you that the images are not small, ~ 2 GB in general.
For these purposes, a Docker image file checker was written in the system using JavaScript.
GitHub Gist is loading...
This script runs a check that determines whether the command is executed inside Docker. I used a simple check for the presence of /.dockerenv file, and this works fine.
As a result, the following command was added to package.json:

Command for verifying the requirements and installation of the wrapper
Now you can use the npm run codeclimate:install command to install the wrapper.
Remark: From the very beginning, I wanted to do everything in JavaScript, without using the .sh file, but the problem was with the last command in setup.sh. No matter how I ran it, the process just hung, and there was no stdout. I used both exec and spawn, but nothing happened. As a result, made as easy.

Run code analysis
Well, now we come to the most important, the goal of the whole article — the launch of code analysis. In this case, you can get a report in three formats: HTML, JSON, and text. The most convenient, of course — this is a report in HTML, it can be immediately viewed in the browser, and the problem can be seen visually. Other formats are useful for your tools.
But in order to successfully run the code analysis inside Docker of the VSCode image, you need to know the real path to the container-mounted repository folder. Codeclimate is based on temporary launches of tool containers, with mounting the source code folder from the host machine into these containers. Accordingly, the paths inside the Docker VSCode container will not work.
To determine a real path to the project's source folder from the host system was written the following script which is located in scripts/volumes/folder:
GitHub Gist is loading...
This script goes through all the running containers (as the "docker ps" is used) and gets all the Mount parameters of the running containers. Then script filters output by the "mad-fake-slack" line and finds JSON with a description of mounting volume folders to Docker, where in the Source field, there is a real path. And if the mount folder path is found with the mention of mad-fake-slack, then this path is returned to the standard output using console.log(). If not found, the script terminates the process with code 1, which should interrupt the chain of commands.
As a result, to launch the analysis, the following command was created:

GitHub Gist is loading...
The result of this command is an HTML report. This report will be saved in the reports folder (this folder is specially created for storing reports).
Useful commands
Since I immediately wanted to make it possible to receive reports in different formats, the following commands were added:
GitHub Gist is loading...
Now, thanks to the codeclimate:analyze command, you can specify the environment variable REPORT_FORMAT=html or REPORT_FORMAT=text or REPORT_FORMAT=json before the command and get the report output in the specified format.
REPORT_FORMAT=html npm run codeclimate:analyze # runs analysis and report output in html format to the reports folder with the name in the form of the current date and time
REPORT_FORMAT=json npm run codeclimate:analyze # runs analysis and report output in json format to the reports folder with the name in the form of the current date and time
REPORT_FORMAT=text npm run codeclimate:analyze # runs analysis and report output in text format to the reports folder with the name in the form of the current date and time
HTML report
The report is as follows. It has links to explanations for each found problem, so that even an inexperienced person can understand and, if desired, correct the found problems. In short, the report is very informative.
Conclusion
In this way, you can set up a local run to analyze the quality of your code. If you are developing in Docker using VSCode, then this will not be a problem for you, but, on the contrary, will help you to be more confident in observing the generally accepted standards of code quality.
Thanks for reading this article! Everything that has been described in this article, I actively use in the OSS project mad-fake-slack.


Latest articles here