
Analyze with AI
Get AI-powered insights from this Mad Devs article:
In this article, I want to share my experience with video streaming for one of our Yourcast projects. You could find more about this project here:

At Yourcast.tv we restream YouTube content in playlists. We wondered what is the average video playtime and what videos are most popular?
In our last major experience with Google Analytics, we were grappling with AdMob, advertising, and ROI. In a few words, we had to count the return of investment for mobile app advertising.
Suppose a user came from the ad, installed the app, made an order and in the case of success, we had to count how much it cost to acquire the user, and how much money user returned using our app.
For Yourscast.tv we wanted to know what videos in Livestream are popular, which stream is most watched and which has the longest playtime. That was our next challenge with Google Analytics.
Solving the challenge
Google Analytics side
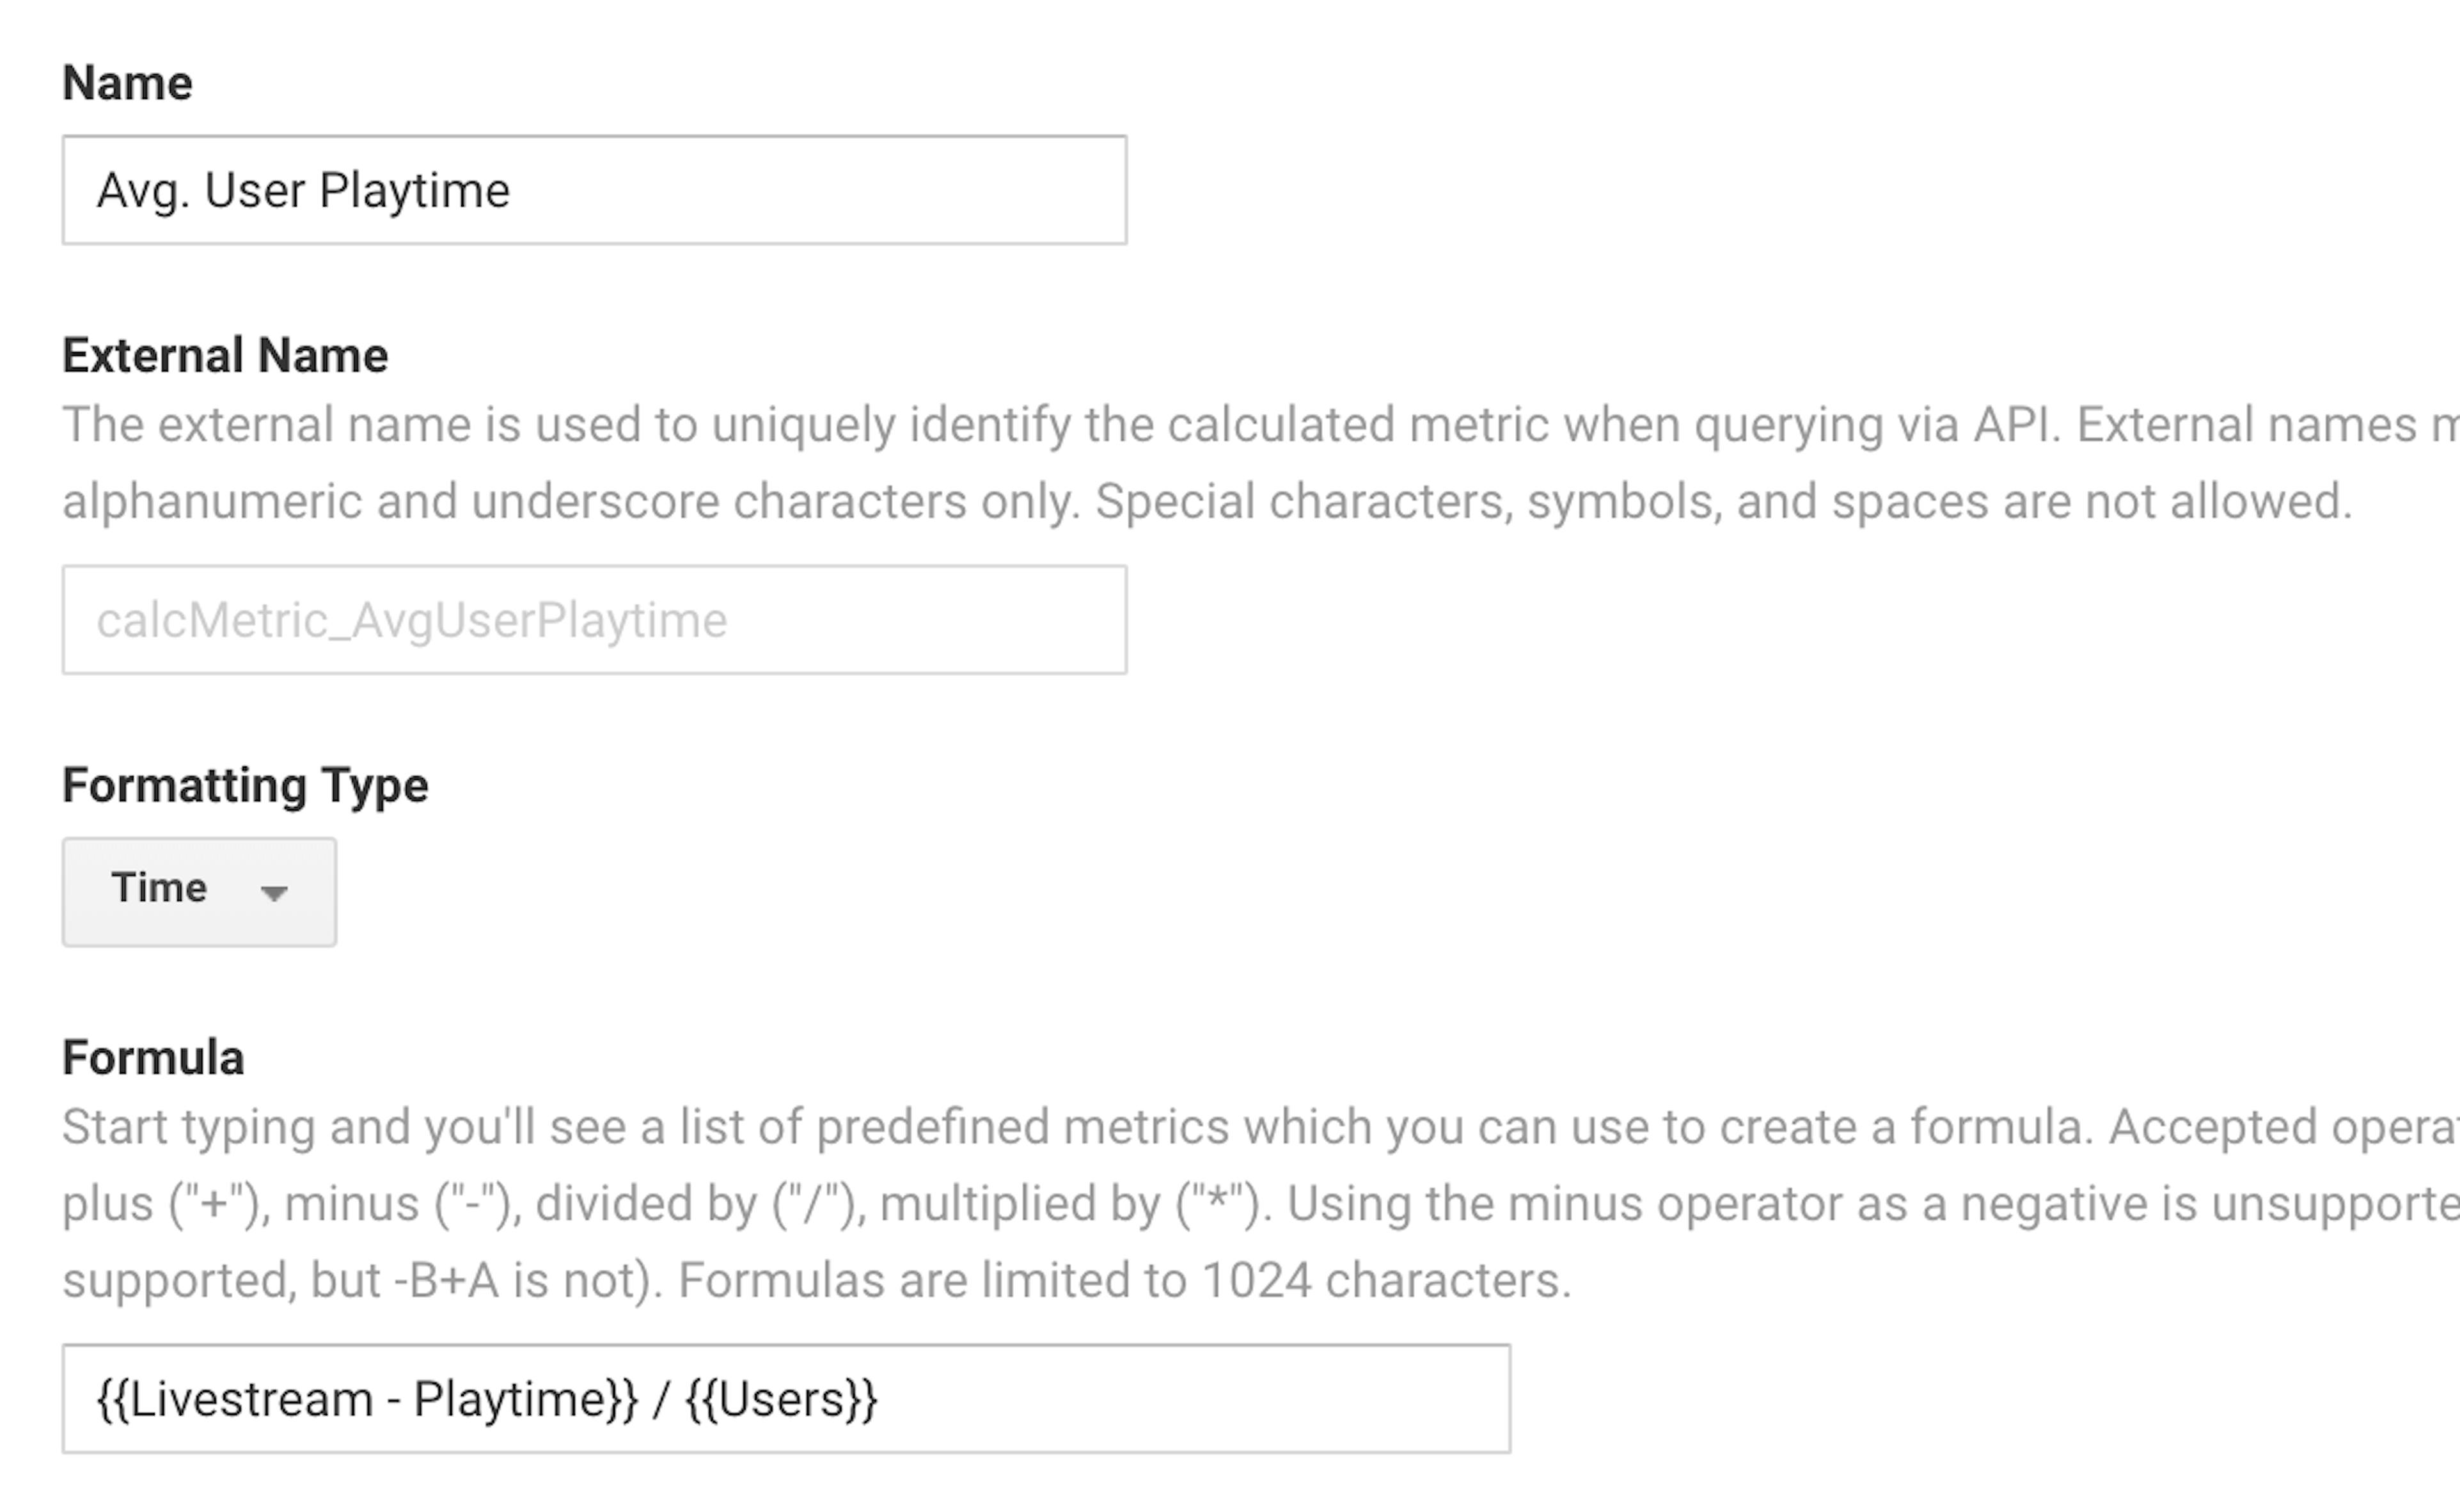
The Google Analytics part involved the addition of variables in 'Custom Dimensions' and 'Custom Metrics' in order to receive the variable values from the streamer. We then used them to create additional variables in 'Calculated Metrics'.
The technical side
In this part, there are two sides of the solution.
- Frontend part. We send data to Google analytics by an interval.
- Server side part. We need to send what video file is started to stream.
On the frontend, the idea is to send data to Google analytics periodically with constant interval while a user is watching video on the website.
We need to send event. We decided to send these values:
- stream slug as event category
- progress as an event action
- dimension2 is id of our custom dimension
- metric3 is our id for custom metric
Working code:
GitHub Gist is loading...
On the streamer, we need to know what video was most popular on our custom live stream and only streamer knows which video is broadcasting now.
In my opinion, the best way to send data from the backend is repeated frontend request with your data. I opened network tab in 'Developer Console' and after some tries, I found that we need to send these data values to google analytics:
- "v" = 1
- cid — client uuid
- t = "event"
- ec — event category
- el — event label
- tid- your google analytics tracking id
GitHub Gist is loading...
Final result
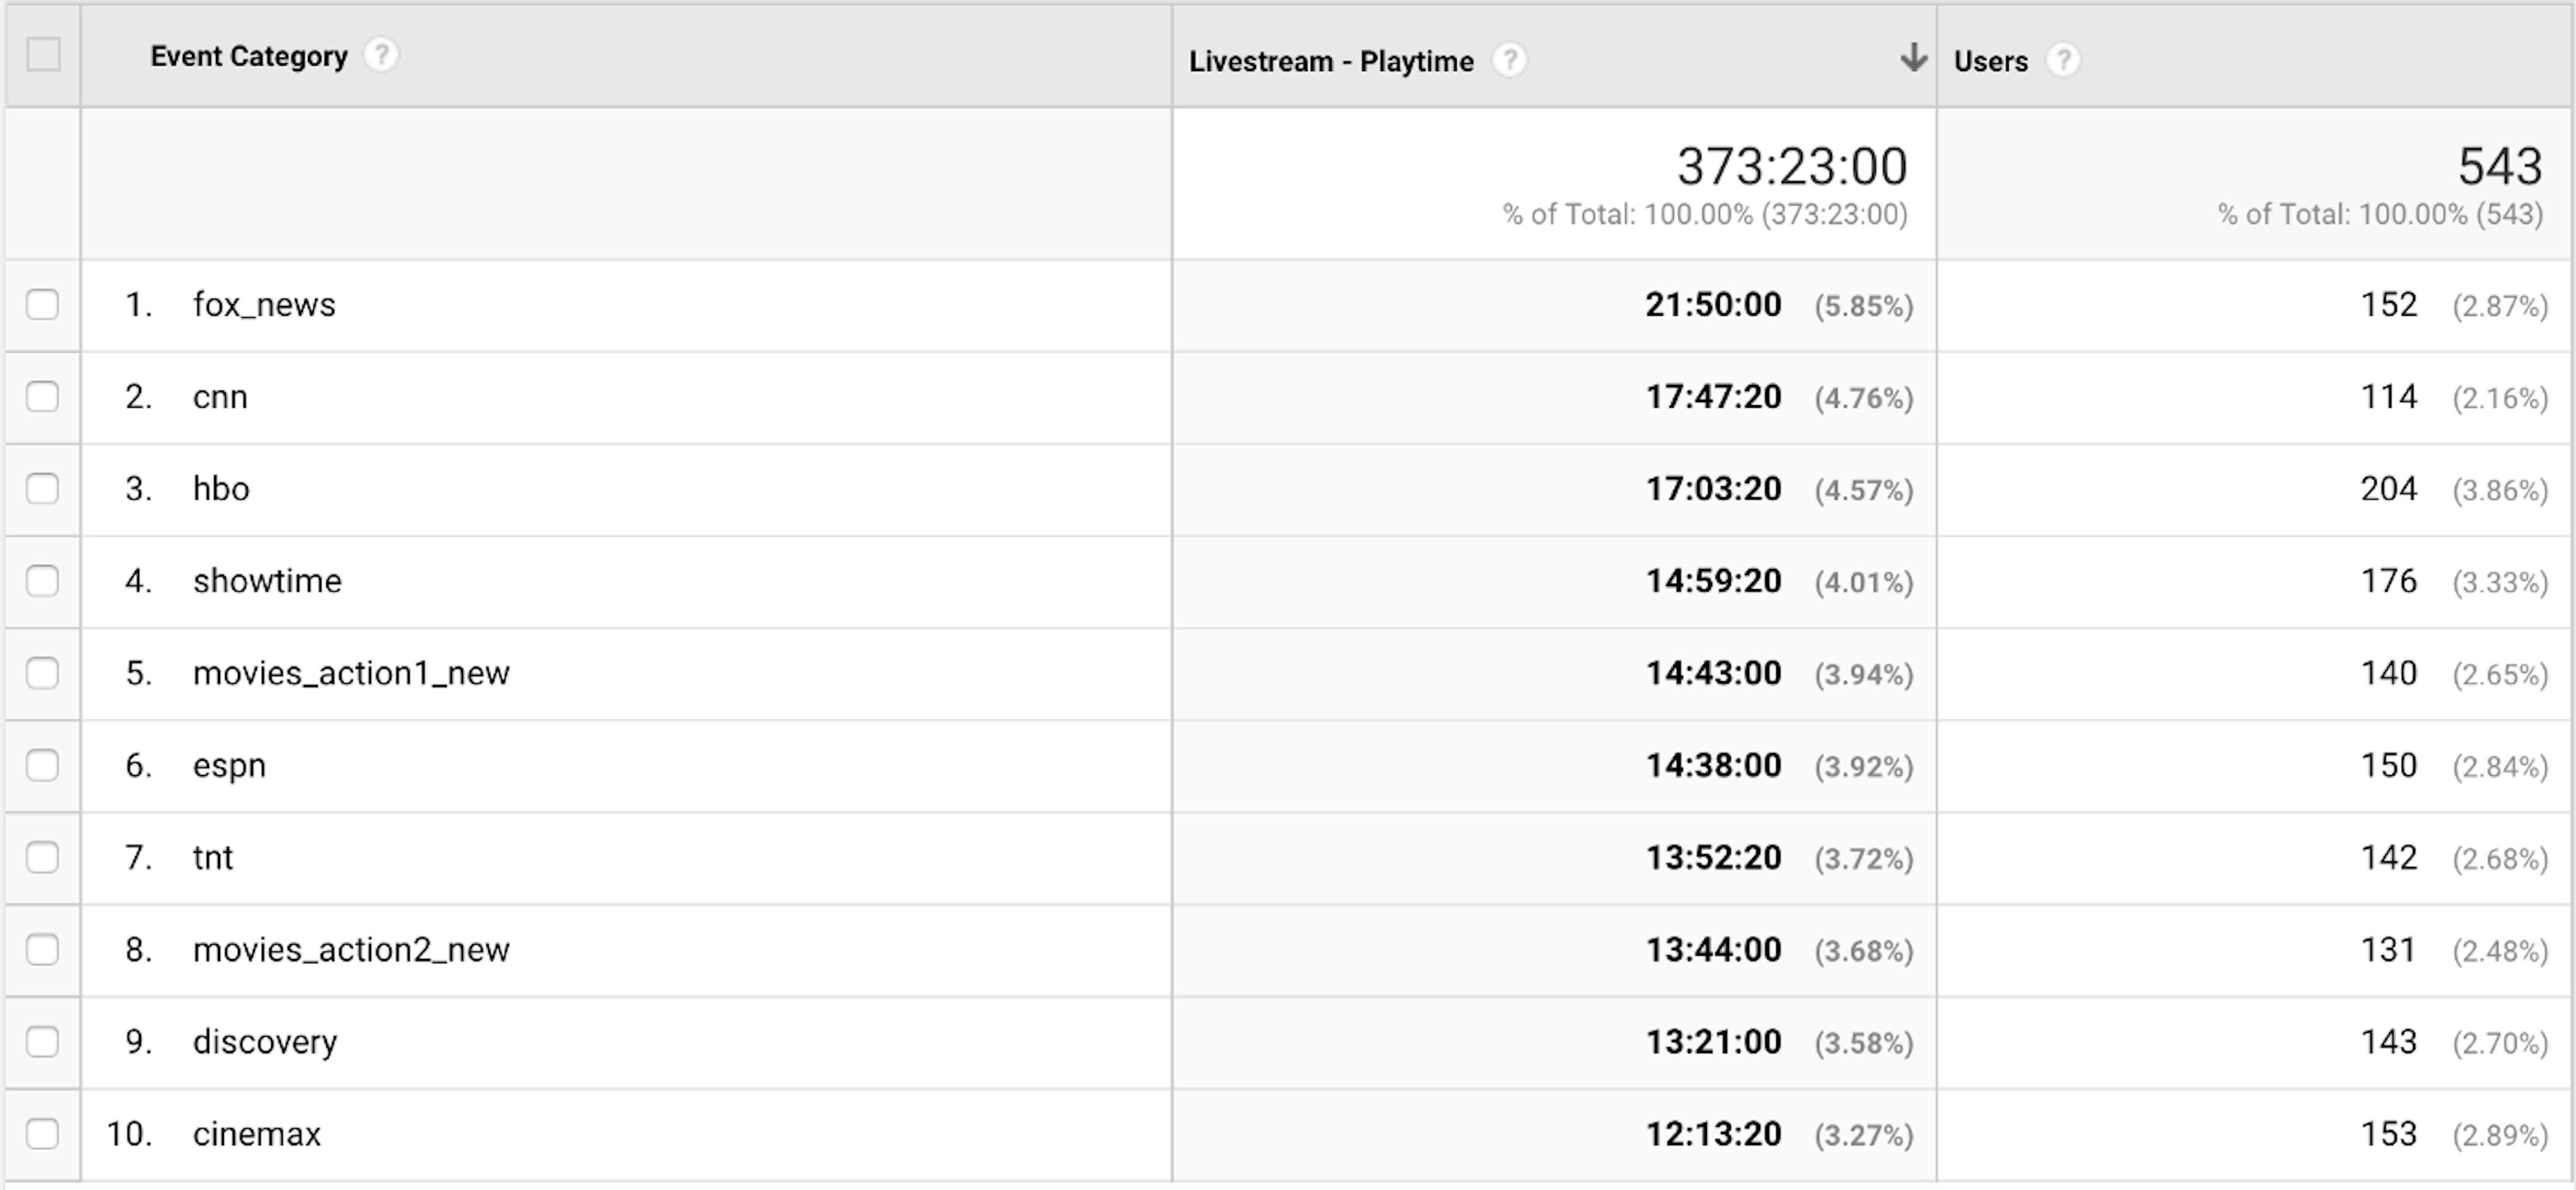
Once we configured the streamer and added the variables, we started receiving additional data from our streams. With this data, we created several custom reports showing top channels by users and average user playtime.
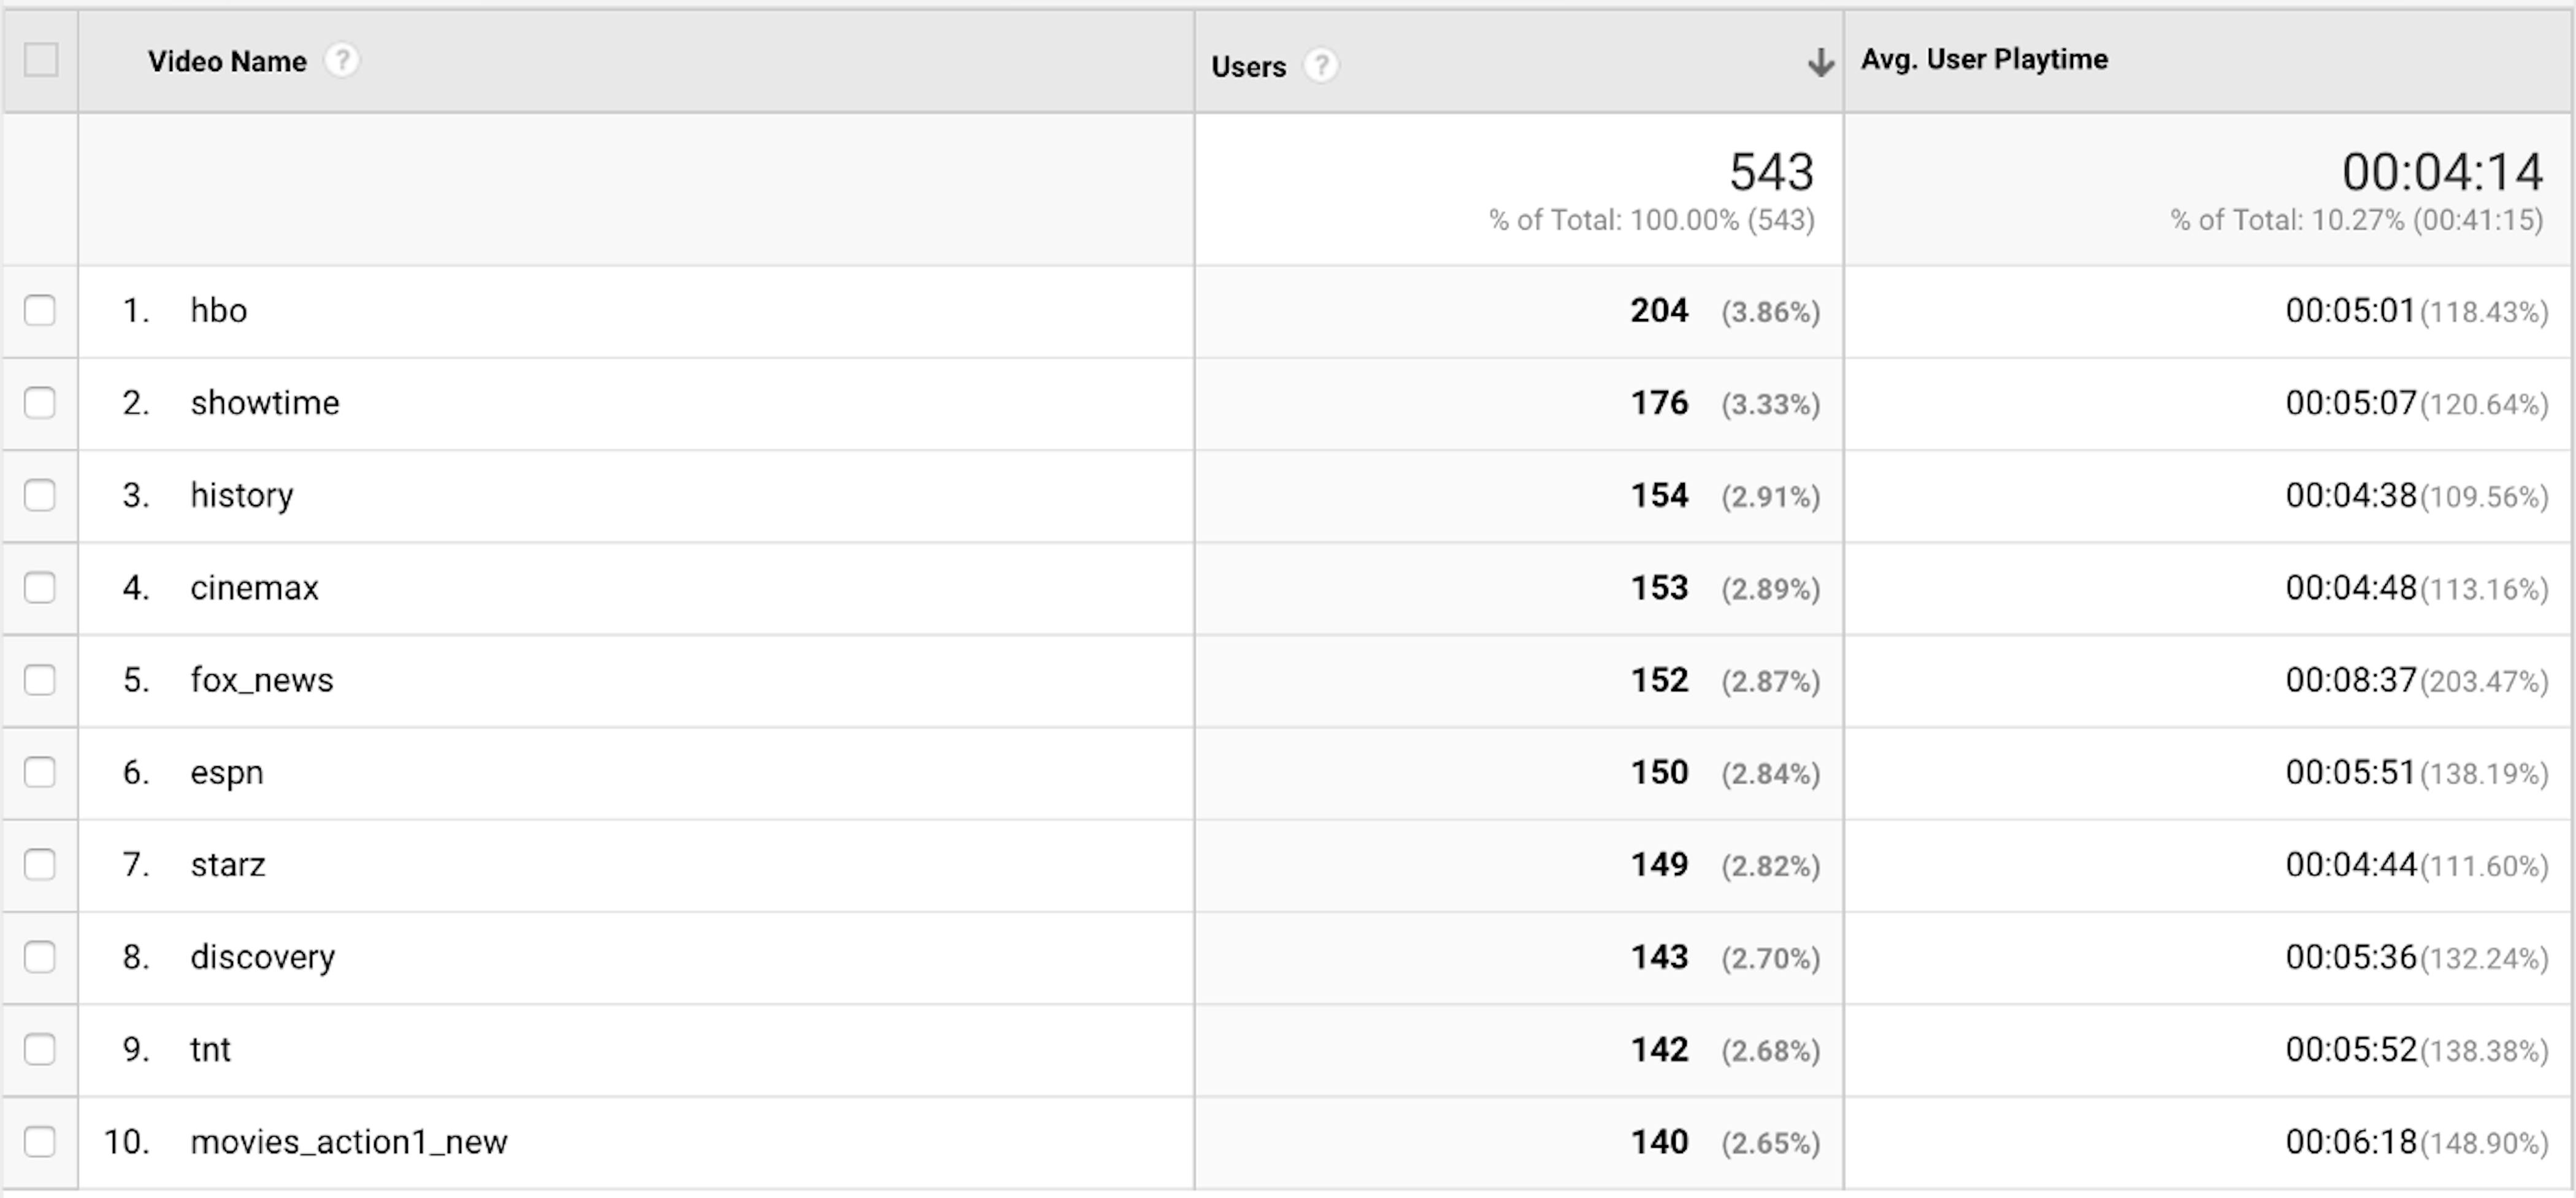
As a result, we know what is preferred by Yourcast.tv users, and how to further improve the streamer content.
P.S. Yourcast.tv is an open source project and available here, without this feature.

Latest articles here