

Analyze with AI
Get AI-powered insights from this Mad Devs article:
Recently, we faced the problem of collecting logs from six main and spare servers with a lot of running applications. Every application generates about 8,000 logs per hour. Also, we will soon need to be collecting logs from ~120 Windows machines. At the moment, there are a large number of ready-made solutions that do not meet our requirements. In the end, we chose the simplest and at the same time elegant solution in the form of a collector and a repository of logsELK(Elasticsearch, Logstash, Kibana) stack, and as a sender—Rsyslog.
Now let's take it one after another:
The problem and the solution
We have three main and three spare servers with a lot of launched applications. Every application writes logs in the JSON-strings format into Syslog. In the near future, we will need to collect logs from a lot of Windows machines, but this is a completely different story.
The schematic solution looks like this:
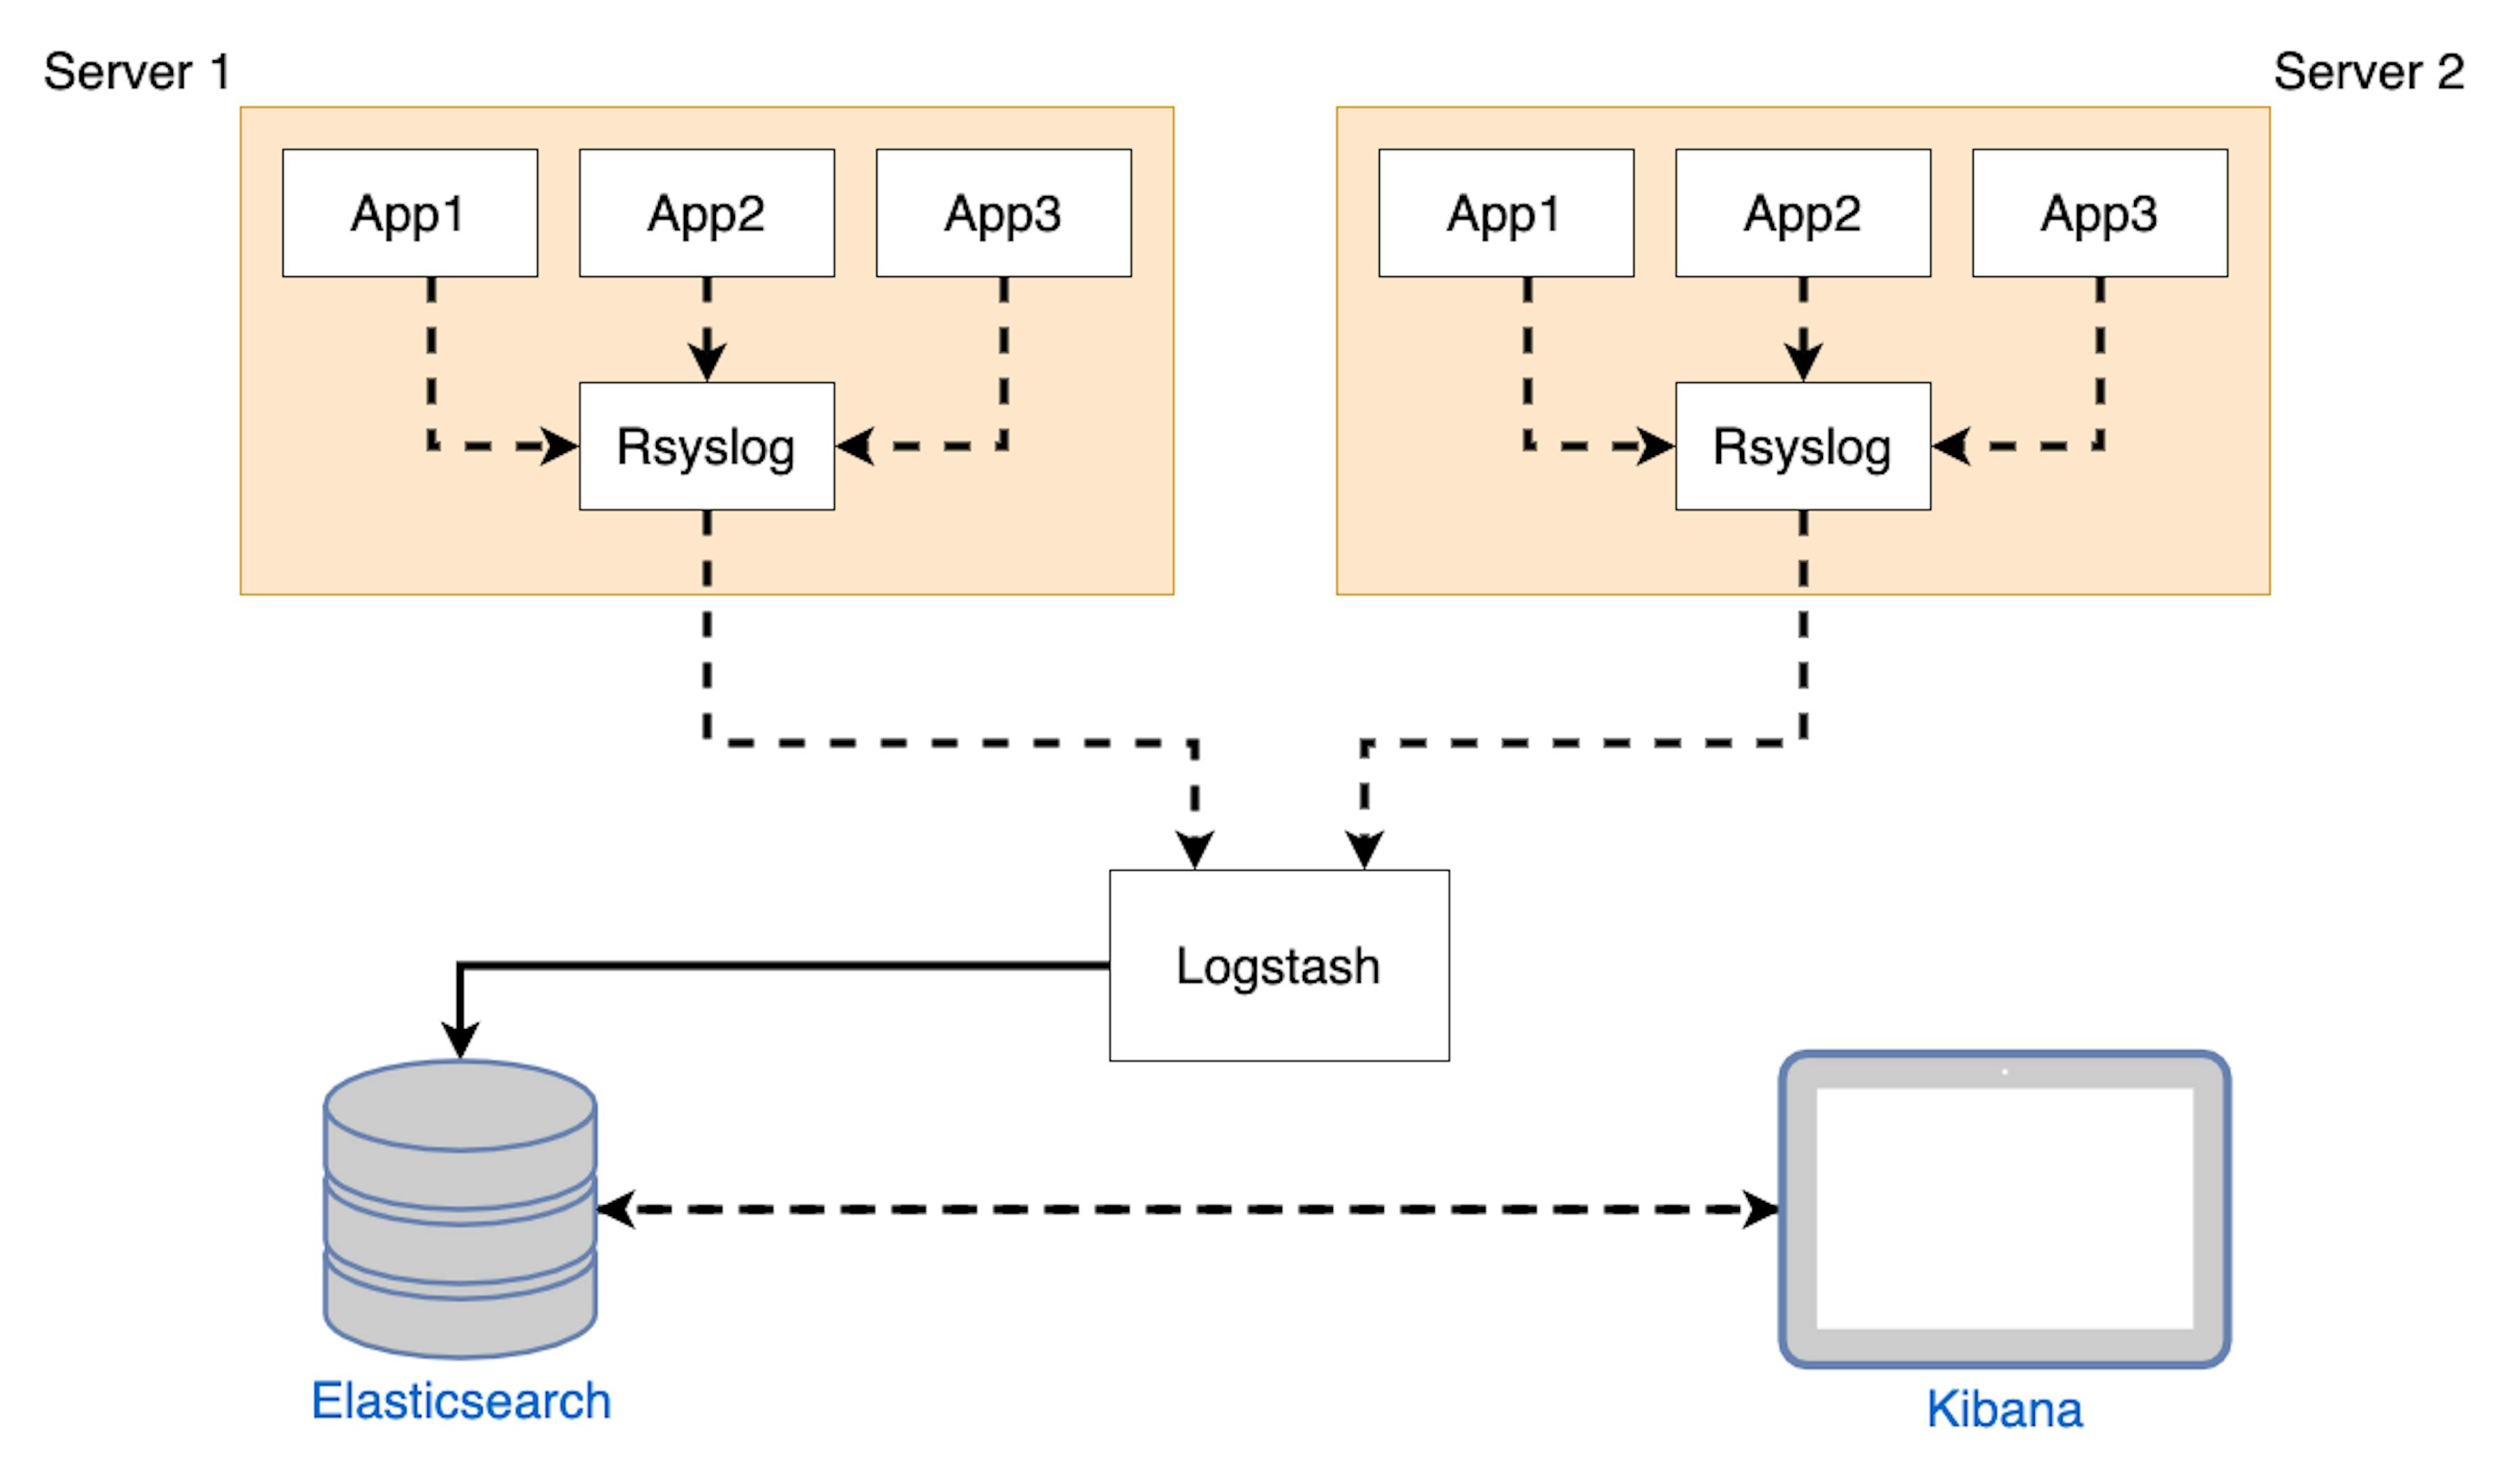
Looks good and scalable. Let's go to preparing and configuring.
Prepare ELK
Because we love Docker, we will use it! And for our convenience, we will use docker-compose.
Docker-compose file:
version: '3.2'

services:
  elasticsearch:
    image: docker.elastic.co/elasticsearch/elasticsearch:7.10.0
    volumes:
      - type: bind
        source: ./elasticsearch/elasticsearch.yml
        target: /usr/share/elasticsearch/config/elasticsearch.yml
        read_only: true
      - type: volume
        source: elasticsearch
        target: /usr/share/elasticsearch/data
    environment:
      ES_JAVA_OPTS: "-Xmx512m -Xms512m"
      discovery.type: single-node
    ports:
      - "9200:9200"
      - "9300:9300"
    networks:
      - elk

  logstash:
    image: docker.elastic.co/logstash/logstash:7.10.0
    volumes:
      - type: bind
        source: ./logstash/config/logstash.yml
        target: /usr/share/logstash/config/logstash.yml
        read_only: true
      - type: bind
        source: ./logstash/pipeline
        target: /usr/share/logstash/pipeline
        read_only: true
    ports:
      - "5000:5000/udp"
      - "9600:9600"
    environment:
      LS_JAVA_OPTS: "-Xmx512m -Xms512m"
    networks:
      - elk
    depends_on:
      - elasticsearch

  kibana:
    image: docker.elastic.co/kibana/kibana:7.10.0
    volumes:
      - type: bind
        source: ./kibana/kibana.yml
        target: /usr/share/kibana/config/kibana.yml
        read_only: true
    ports:
      - "5601:5601"
    networks:
      - elk
    depends_on:
      - elasticsearch

networks:
  elk:
    driver: bridge

volumes:
  elasticsearch:
We don't use scaling, because for now, one node is enough. But in the future, we will have to think about scaling.
Elasticsearch configs:
cluster.name: "docker-cluster"
network.host: 0.0.0.0

# X-Pack settings
xpack.license.self_generated.type: basic
xpack.security.enabled: true
xpack.monitoring.collection.enabled: true
Kibana configs:
server.name: kibana
server.host: "0"

# X-Pack settings
xpack.monitoring.ui.container.elasticsearch.enabled: true

# Elasticsearch settings
elasticsearch.hosts: [ "http://elasticsearch:9200" ]
elasticsearch.username: elastic
elasticsearch.password: strongpassword
Logstash configs:
http.host: "0.0.0.0"

# X-Pack settings
xpack.monitoring.elasticsearch.hosts: [ "http://elasticsearch:9200" ]
xpack.monitoring.enabled: true
xpack.monitoring.elasticsearch.username: elastic
xpack.monitoring.elasticsearch.password: strongpassword
Logstash pipeline configs:
input {
    udp {
        port => 5000
        codec => "json"
        type => "rsyslog"
    }
}

filter {
    json {
        source => "message"
        skip_on_invalid_json => true
    }
}

output {
    elasticsearch {
        index => "syslogs-%{+YYYY.MM}"
        hosts => "elasticsearch:9200"
        user => "elasticuser"
        password => "strongpassword"
    }
}
After all, we can just run our stack.
docker-compose up -d
After all, containers are started, you can go to the address 127.0.0.1:5601 and if everything is done correctly, we get into the Kibana web interface.
Prepare Rsyslog on servers
First of all, we need to make sure that all the logs from the applications fall into Syslog.
Go to /etc/rsyslog.d/ and create two files:
- File "01-json-template.conf"
I will prepare a template for outgoing data. Let's deal with the structure. The first value its timestamp for future filtering. Further, messages from the application converted into JSON format. The next value is sysloghost; it's the name of the server host machine: we need it because, in the future, we will need to separate the logs from different servers. And the last value is programname; it's the name of the application that has written the log.
template(name="json-template" type="list") {
    constant(value="{")
      constant(value="\"@timestamp\":\"")     property(name="timereported" dateFormat="rfc3339")
      constant(value="\",\"message\":\"")     property(name="msg" format="json")
      constant(value="\",\"sysloghost\":\"")  property(name="hostname")
      constant(value="\",\"programname\":\"") property(name="programname")
    constant(value="\"}\n")
}
2. File "60-output.conf"
if $programname == ["app1","app2","app3"] then @elk-server-api:5000;json-template
*Array matching working only in rsyslog ≥ 7.2
Go to Kibana
First, to configure Kibana, go into Management/Index Patterns and create Pattern syslogs-*. After this, Kibana will find all our log indexes.
In the Kibana Discover page, we can use Kibana Query Language(KQL) for selecting and filtering logs. Examples:
- Get logs only from "Server2":
sysloghost : "Server1"
- Get "App2" logs from "Server1"
sysloghost : “Server1” and programname : “App2”
- Filter by level:
sysloghost : "Server1" and programname : "App2" and level : "info"
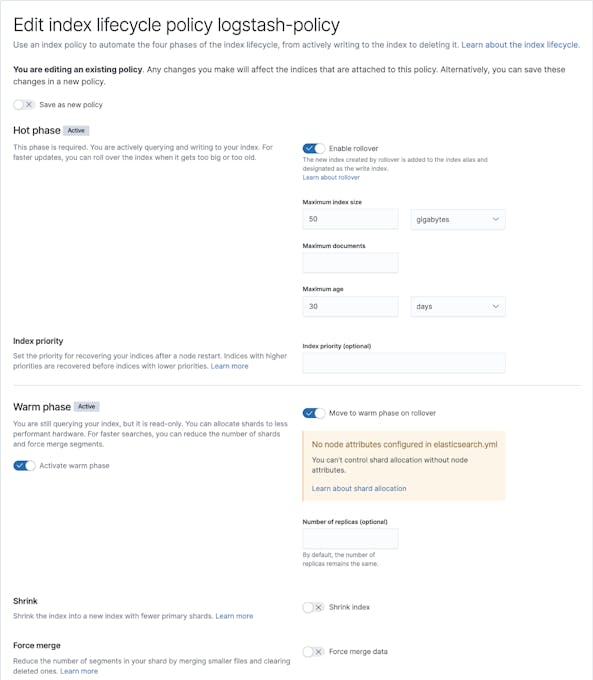
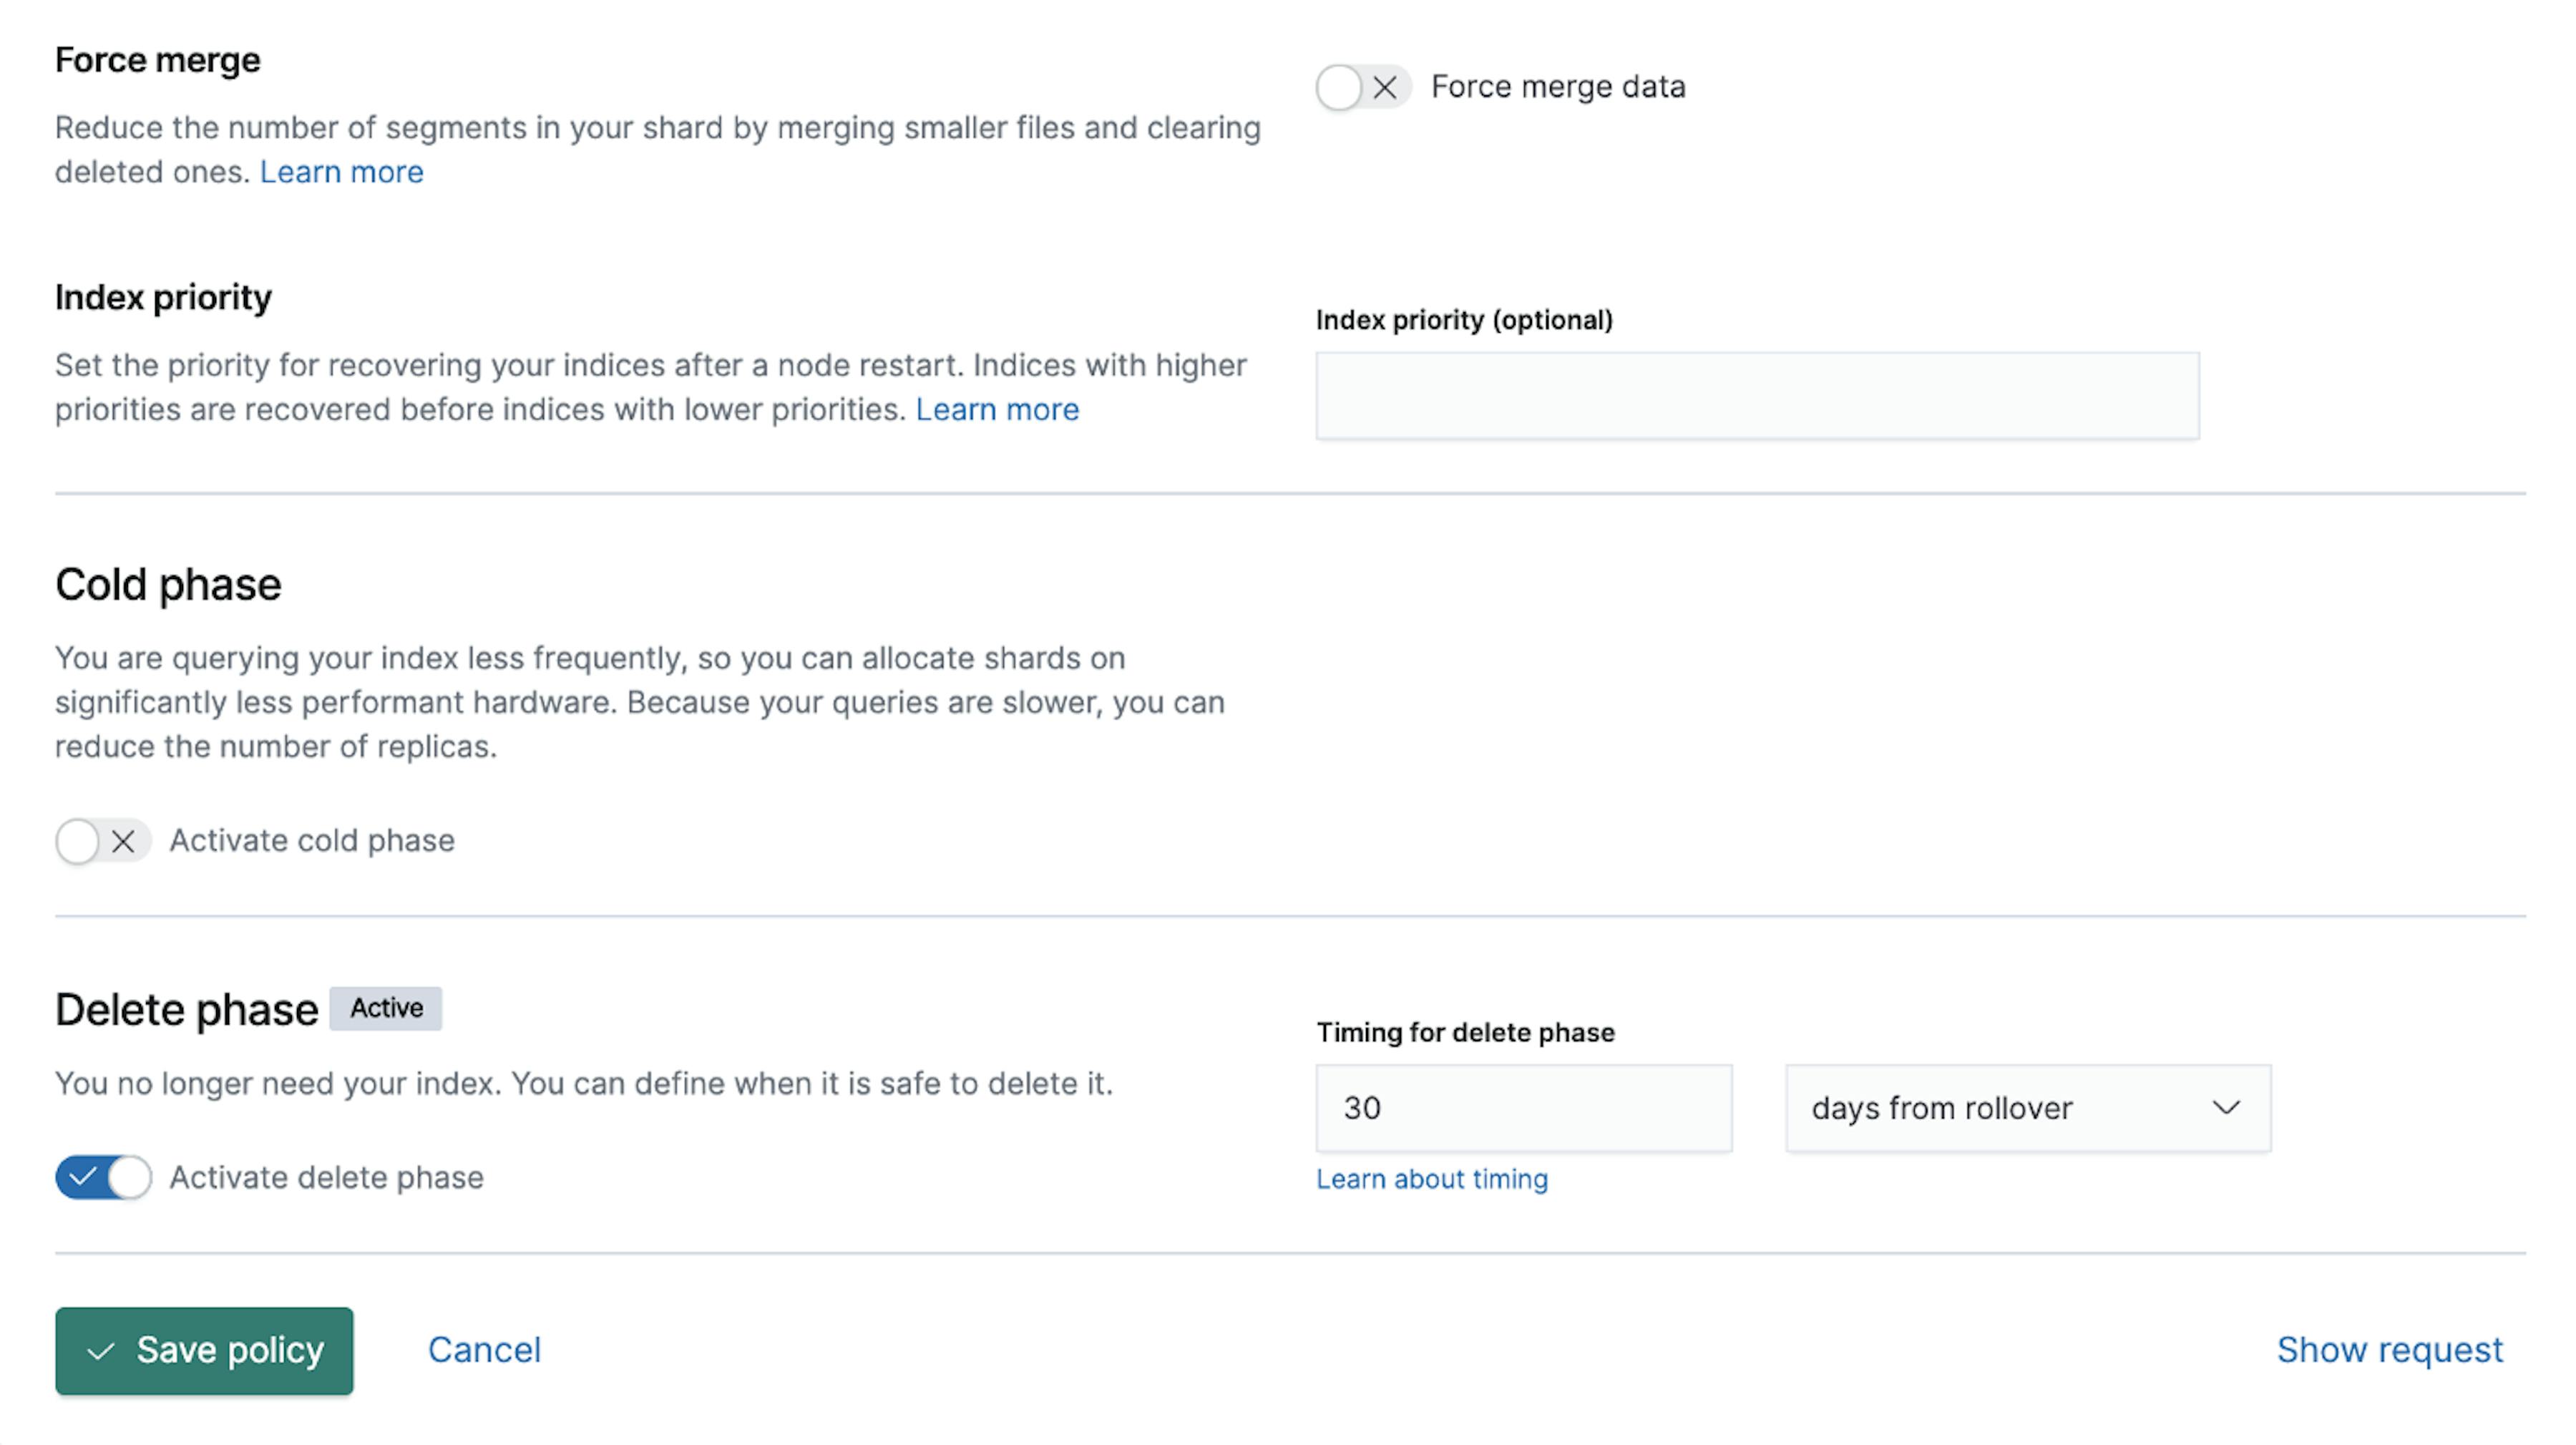
P.S. Don't forget to configure your Index Lifecycle Policies (ILM).
Our example of the Index Lifecycle Policies:
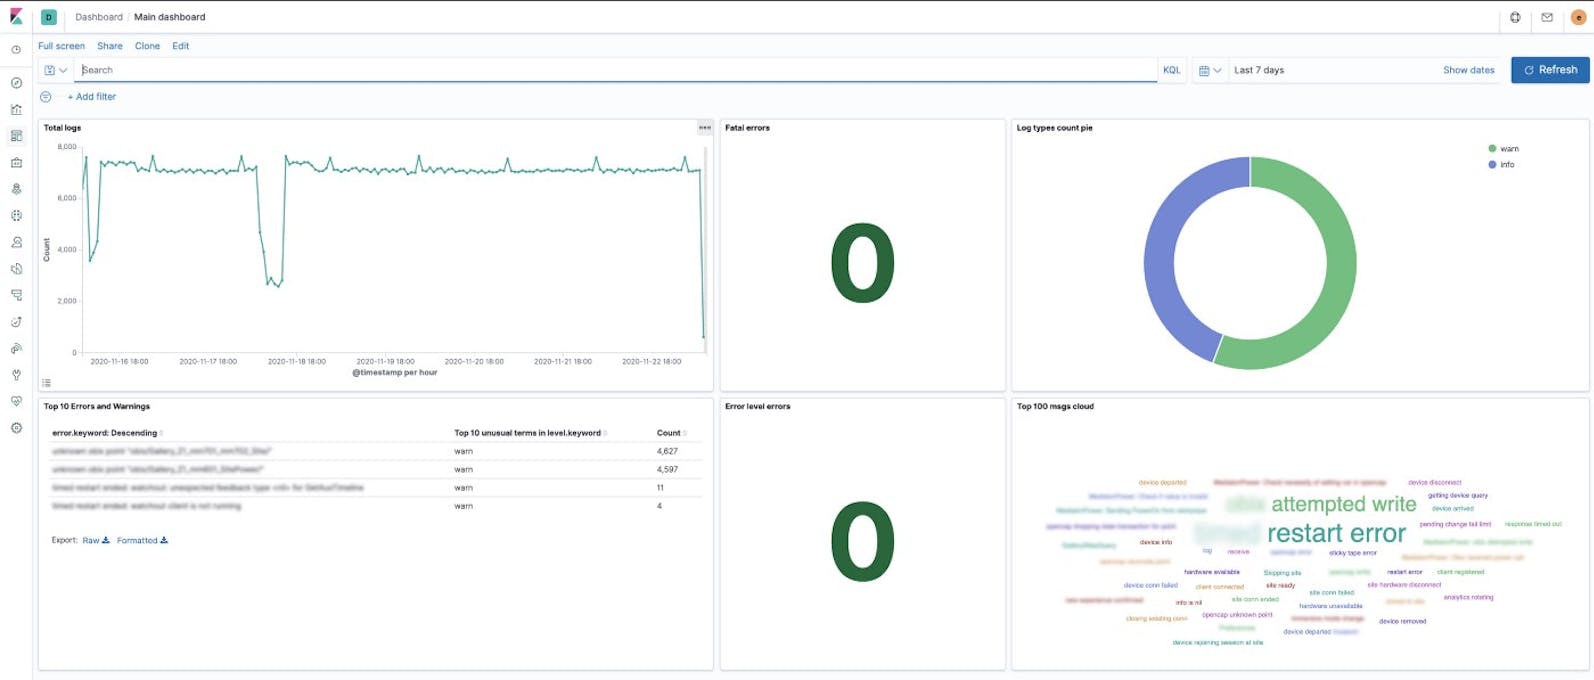
That's all. For more convenient log monitoring, we have set up the simple Kibana Dashboard. It looks like this:


Latest articles here