


Analyze with AI
Get AI-powered insights from this Mad Devs article:
Software development is a field of constantly and rapidly growing competition, where every decision makes a big difference. And the more complex the project, the more difficult it is to see the complete picture and make profound decisions to maintain speed, flexibility, and quality of development. That is why you need tools that help you automate the provision of thorough and complete reports so that you are always aware of the real state of the project. Today we will talk about such reporting tools for software development.
Consider what kinds of reporting can be performed by such reporting tools, which are valuable for a business making decisions and running the project. We'll discuss what specific benefits come from the right choice and use of reporting tools and what features they should have to provide these benefits. We'll also examine the most popular open-source reporting tools and their proprietary and paid alternatives, which can provide even more benefits and features.
Let's get started if you're ready for a detailed comparison of the tools that will make your software development much more transparent and efficient and your decision-making much more informed.
Reporting tools: what is it?
Reporting tools are software that provides reporting, decision-making, and business intelligence capabilities. It is also used to transform raw data into knowledge. These tools also allow you to extract and present data through charts, tables, and other visualization formats. In other words, their goal is to organize and visualize data from different sources.
Benefits of using reporting tools in software development
There are many benefits of using reporting tools, depending on each case. Let's focus on the most key ones, from which all the others come out.
- Time savings
Reporting automation streamlines data organization, reducing the time spent on manual reporting tasks. This allows software development teams to focus on their core responsibilities, such as coding and testing. - Flexibility
Customizable reporting tools enable teams to measure and compare the parameters most relevant to their project's success, such as code quality, defect rates, and sprint velocity. - Visualization
Advanced visualization capabilities, including diagrams, infographics, and interactive dashboards, enhance the communication of complex data to stakeholders, facilitating informed decision-making. - Objectivity
Data-driven reports provide accurate insights into a project's progress, ensuring that decisions are based on concrete evidence rather than subjective opinions. - Collaboration
Reporting tools can foster collaboration by providing a shared platform for team members to track progress, identify dependencies, and discuss issues in real-time.

Functions that reporting tools need include
Reporting tools must include several features to benefit every company and project fully. The more these features and the better their design, the more immediate and apparent they will result.
| FUNCTIONS THAT REPORTING TOOLS NEED INCLUDE | |
|---|---|
| Internal process optimization | The tool should enable teams to analyze their workflows and identify inefficiencies, allowing for continuous improvement of development practices. |
| Problem and bottleneck identification | This platform offers a chatbot builder that can be used to create custom chatbots for HRM, including onboarding, employee engagement, and performance management. |
| Resource management | The reporting tool should assist in tracking and allocating resources efficiently, including team members' time and effort, to ensure optimal project outcomes. |
| Risk assessment and mitigation | Reporting tools should provide insights into potential risks associated with a project, facilitating proactive risk management and mitigation strategies. |
| Integration with existing tools | To maximize their utility, project management reporting tools should seamlessly integrate with popular software development platforms and tools, such as version control systems, issue trackers, and continuous integration pipelines. |
| Customizable reporting templates | The tool should offer a variety of customizable templates to accommodate different types of reports, ensuring that stakeholders receive the most relevant information for their needs. |
Types of development reports provided to businesses
Of course, every business has to improve the world by providing better products and services. That means businesses need to optimize and improve themselves by closely watching the processes and clearly seeing the results. Achieving that asks turning all development aspects into measurable figures and making them visible and usable. So these aspects are taken into account in the reports that we will talk about below.
- Revenue and profitability reports
Offer insights into a company's financial performance, highlighting areas of growth and potential improvement. - Resource allocation reports
Detail how resources, such as personnel and budget, are allocated across various projects to optimize resource utilization. - Budget tracking reports
Monitor project expenses to ensure alignment with allocated budgets and identify potential cost overruns. - Sales reports
Provide an overview of software product sales, broken down by region, customer segments, or product lines. - Customer usage reports
Analyze user behavior within the software, such as features utilized and usage patterns, to tailor offerings to customer needs. - Marketing analysis reports
Evaluate the effectiveness of marketing campaigns, identifying successful strategies and areas for improvement. - Product roadmap reports
Outline planned development and release of new features or products, informing stakeholders about the company's strategic direction. - Risk analysis reports
Identify potential risks associated with a project, helping businesses develop mitigation strategies. - Industry benchmarking reports
Compare a company's performance against industry standards to gauge competitive standing. - Return on investment reports
Measure the financial benefits derived from a project or investment, ensuring effective resource allocation. - Competitor analysis reports
Provide insights into competitor offerings, strategies, and market positioning to inform a company's competitive strategy. - Market research reports
Identify market trends, opportunities, and challenges to guide business decisions and product development. - Sales forecasting reports
Predict future sales based on historical data and market trends, aiding in resource planning and revenue management. - Customer satisfaction reports
Gauge customer sentiment towards a company's products or services, identifying areas for improvement. - Proposal reports
Outline the goals, scope, and potential benefits of a proposed project or investment, helping stakeholders evaluate feasibility.
Types of development reports provided to project members
While businesses need some types of reports to understand project status and make decisions, project participants need other types of reports. When a large and complex project involves many technical specialists from different areas, it becomes easy to lose an understanding of the overall project state. That is why these reports are primarily aimed at quality maintenance and presentation of the project for each project participant, providing transparent, flexible, and smooth development.
- Code quality reports
Assess code quality, identifying issues such as code smells, style inconsistencies, and potential bugs. - Testing reports
Detail the results of software tests, including pass/fail rates, defect classifications, and areas requiring attention. - Code coverage reports
Measure the percentage of code covered by tests, ensuring comprehensive testing of the software. - Sprint progress reports
Track the completion of tasks within a sprint, helping teams gauge progress toward project milestones. - Bug and issue tracking reports
Document known software bugs and issues, enabling teams to prioritize and address problems. - Function utilization reports
Analyze the usage of specific software features, helping teams identify areas for improvement or feature enhancement. - Performance metrics reporting
Measure software performance, such as load times and response rates, ensuring optimal user experience. - User feedback reports
Collect and analyze user comments, suggestions, and complaints, informing product development and refinement. - Build status reports
Track the status of software builds, including successful and failed builds, as well as any associated issues. - Release history reports
Document changes made in each software release, providing a comprehensive record of product evolution. - Project timeline reports
Visualize the progression of a project, highlighting completed tasks and upcoming milestones. - Sprint retrospective reports
Evaluate the success and challenges of a sprint, identifying areas for improvement in future sprints. - Charts reports
Provide visual representations of key project metrics, such as burndown charts and cumulative flow diagrams, for easy interpretation and communication. - Code review reports
Summarize the results of peer code reviews, including identified issues, suggestions for improvement, and best practices, fostering collaboration and continuous improvement. - Dependency analysis reports
Analyze relationships between software components, identifying potential bottlenecks and helping teams optimize their codebase structure. - Technical debt reports
Provide insights into the accumulation of suboptimal design choices, code smells, or incomplete features that may hinder future development, allowing teams to prioritize and address these issues proactively.
It is important to note that this describes the different types of reports per se. In the case of various reporting tools, they can be interpreted or combined in different ways, complementing each other to provide a comprehensive picture.
Top open-source reporting tools
Let's start with open-source reporting tools because they appeal to many. The open-source code base creates reasonable trust and often the possibility of high customization and free use. This deservedly puts them on par with even more advanced solutions and serves as a deciding factor for a huge number of companies.
For example, we at Mad Devs highly respect and actively participate in many open-source projects, understanding how this development approach drives the whole industry forward. For instance, among other projects, we have Mad Radiator, which provides a simple way to collect a part of data from Analytics, Lighthouse, Reddit, Quora, and Glassdoor, after sending it in a pretty format as a message to Slack and Telegram. And, of course, it's fully open to anyone and free for any company to use.
Metabase
Metabase is a free and easy-to-use open-source reporting tool with a user-friendly interface and comprehensive reporting capabilities. It is ideal for businesses seeking an elegant solution with a unified interface for their reporting needs.
Metabase consists of a web-based application and a data processing engine, which allows it to connect to various data sources such as SQL databases, CSV files, and more. It supports multiple data formats and can generate reports like PDF, CSV, and JSON. Metabase is written in Clojure and runs on any platform because of its web-based solution, including Windows, Linux, and Mac.
We at Mad Devs use Metabase as a reporting tool in our internal projects due to its user-friendly interface and all functions that cover all reporting needs. It sets up in five minutes, connects to databases, and brings data in clear and beautiful visuals.
Jasper Reports
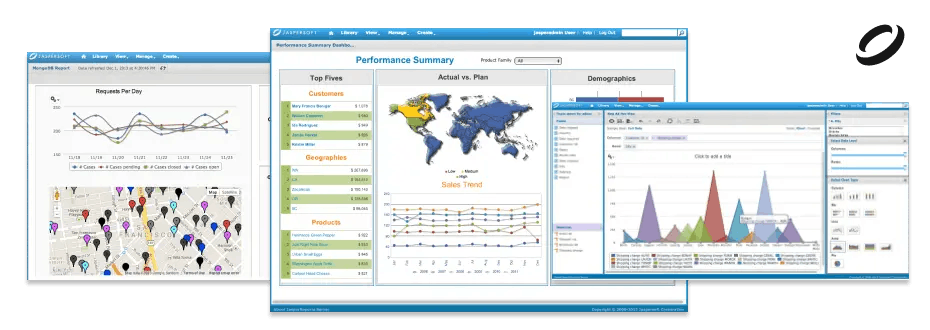
Jasper Reports is a widely used open-source reporting tool that stands out for its seamless integration capabilities and feature-rich reporting environment. Also, JasperReports is known for its pixel-perfect report generation, allowing users to create visually appealing reports with precise control over layout and design. So it is excellent for businesses seeking a customizable, extensible solution to create complex reports easily.
It consists of several components: JasperReports Library, JasperReports Studio, and JasperReports Server, which make it easier to integrate into existing IT architectures. JasperReports supports multiple data sources and formats, including PDF, HTML, XLS, RTF, ODT, CSV, TXT, and XML files. It is written in Java and runs on Windows, Linux, and Mac.
BIRT
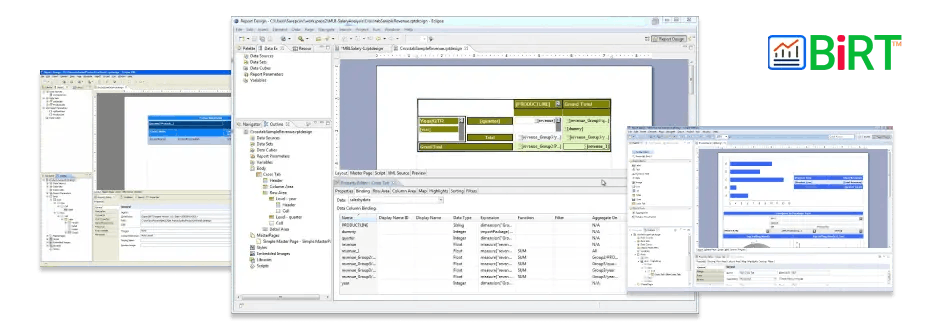
BIRT (Business Intelligence and Reporting Tools) is an open-source reporting tool designed for users seeking a powerful and flexible solution for data visualization and reporting. With its robust customization options and support for various data sources, it is a good choice for businesses that require advanced data analysis and presentation capabilities.
BIRT consists of a visual report designer and a runtime component for seamless Java environment deployment. Reports can be saved in XML format and exported to popular formats such as PDF, HTML, XLS, and DOC. It is written in Java and runs on Windows, Linux, and Mac.
Seal Report
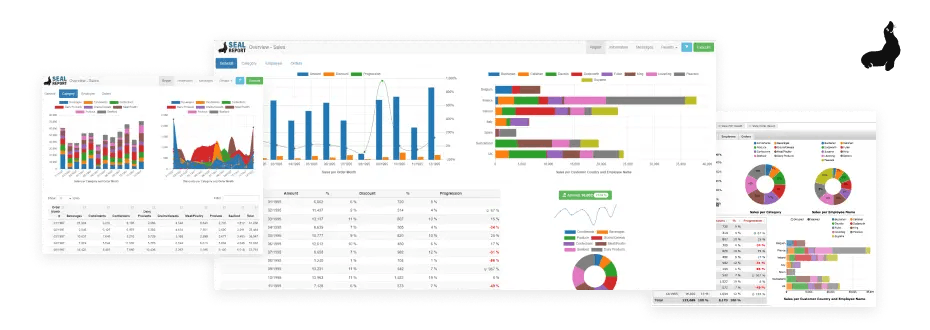
Seal Report is a comprehensive open-source reporting tool that focuses on easy installation and report design, making it ideal for users looking for a straightforward and efficient solution. With its user-friendly interface and extensive reporting capabilities, it is a good option for businesses seeking a reliable and simple reporting tool.
It can compose reports from any data source and offers a range of features, including dynamic SQL data sources, local pivot tables, and HTML5 charts. Reports can be exported in various formats, such as PDF, Excel, and HTML. Seal Report is written in C# and specifically designed for the Microsoft environment, ensuring seamless integration with existing Microsoft-based systems. It runs on Windows, Linux, and Mac.
Top proprietary reporting tools
However, you should understand that open-source reporting tools may not have many features right out of the box, require extra time to configure, may not be as easy to use, and may not be updated as often to improve their design, functionality, and security. That's why there's always a reason to consider proprietary solutions, which may require a little more cost, but bring much more benefits in a much shorter time frame.
Enji.ai
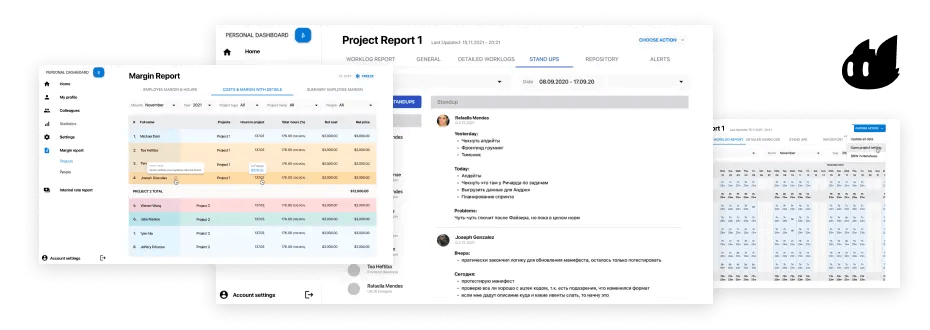
Enji is a comprehensive development analyzing and reporting tool focused on automating project management and team collaboration for agile software development. It provides visibility, enhances transparency, tracks project progress, and streamlines workflows.
It delivers Real-Time Team Reports sharing in Slack and Telegram and performs Project Reports, Finance Reports, and HR Reports on the front end, supporting various data sources, including GitHub, GitLab, Bitbucket, Jira, and data formats such as CSV. Enji is a cloud-based solution and runs in Kubernetes and AWS. Also, with API integration capabilities, Enji seamlessly integrates with any existing infrastructure and easily connects tools.
Overall, Enji is a powerful tool that helps constantly keep an eye on project changes, providing daily notifications and alerts about the blockers, enabling teams to ongoing monitoring, identify improvement areas, and make data-driven decisions for performance optimization.
⚙️ Do you want to know more about how Enji can automate your business? Feel free to contact us for details. You will be surprised how many processes can be easily improved and resources can be greatly optimized by implementing Enji.
Jellyfish

Jellyfish is a development reporting tool emphasizing engineering analytics and insights to help organizations make informed decisions. Its primary goal is to provide visibility into the performance and productivity of software development teams.
Jellyfish's core features include customizable reports, project tracking, and team performance analytics. It supports a variety of data sources, such as Git, GitHub, Bitbucket, and Azure DevOps, and can work with data formats like JSON, CSV, and XML. Jellyfish is developed using JavaScript and is compatible with multiple platforms, including Windows, macOS, and Linux.
Tableau

Tableau is a widely popular data visualization tool focusing on ease of use and powerful analytics capabilities. It consists of Tableau Desktop, Tableau Prep, Tableau Server, and Tableau Online.
Tableau supports many specific data sources, including Excel spreadsheets, MySQL, PostgreSQL, Oracle, Microsoft SQL Server, and others. It also supports popular cloud-based services such as Google Analytics, Salesforce, and Amazon Redshift. It supports various such data formats as CSV, PDF, and JSON. Written in Java, Tableau is available for Windows and Mac and can be deployed on-premise and in the cloud.
Blue Optima

Blue Optima is a reporting tool that measures software development productivity through objective metrics. It helps businesses gain insights into their processes, improving cost and resource efficiency.
Key components of Blue Optima include software development effort analytics, code quality analysis, and resource optimization insights. The tool can integrate with various data sources, such as Git, SVN, and Perforce, and project management tools like Jira and Azure DevOps. Blue Optima supports multiple data formats, including JSON, CSV, and XML. It is developed using Java and can be deployed on various platforms, including Windows, macOS, and Linux.
Status Hero

Status Hero is a development reporting tool that tracks daily goals, monitors team progress, and fosters effective communication among team members. It is designed to help teams stay on track and aligned with project objectives.
The tool includes goal tracking, progress reporting, and team collaboration features. Status Hero can integrate with various data sources, including popular project management platforms like Jira, Trello, and Asana and version control systems like Git. It works with various data formats such as JSON, CSV, and XML. Written primarily in Ruby, Status Hero is compatible with multiple platforms, including Windows, macOS, and Linux.
Comparing the reporting tools key points

Summary
Now you see what a tremendous amount of work can be done much faster and better, providing a much more complete picture of the progress and features of your project.
Whether you choose open-source reporting tools for maximum resource savings or proprietary reporting tools for maximum benefits, you'll be doing yourself a huge favor by greatly expanding your project management capabilities, improving your product development, and making your decision-making much more reasonable and visionary.
And if you still have questions about how you can automate your business, making development more measurable and efficient, then contact us for a free consultation. We will carefully study your case, and provide you with the most profound and beneficial solution.


FAQ
How can my team benefit from using a reporting tool for software development?
Are reporting tools for software development easy to integrate with our existing workflow
How do reporting tools ensure data security and privacy in our software development projects?
Can reporting tools help us find and address bottlenecks in our software development process?
How can reporting tools help improve code quality and reduce the number of bugs in software development projects?
Latest articles here