
No Bad Questions About DevOps
Definition of Kubernetes monitoring
What is Kubernetes monitoring?
Kubernetes monitoring is the process of tracking the health, performance, and resource usage of Kubernetes clusters in real time. It enables DevOps and tech teams to identify issues early, manage workloads proactively, and ensure the stability of containerized environments by monitoring metrics like CPU, memory, storage, and interactions between cluster components.
Kubernetes monitoring is like your body's nervous system. Your brain (the control plane) needs constant input about how your body parts (pods, nodes, services) are functioning. Monitoring acts as the nerves. It senses temperature, stress, and movement (resource usage and component health) and immediately sends signals if something's wrong, allowing your system to react before serious damage occurs.
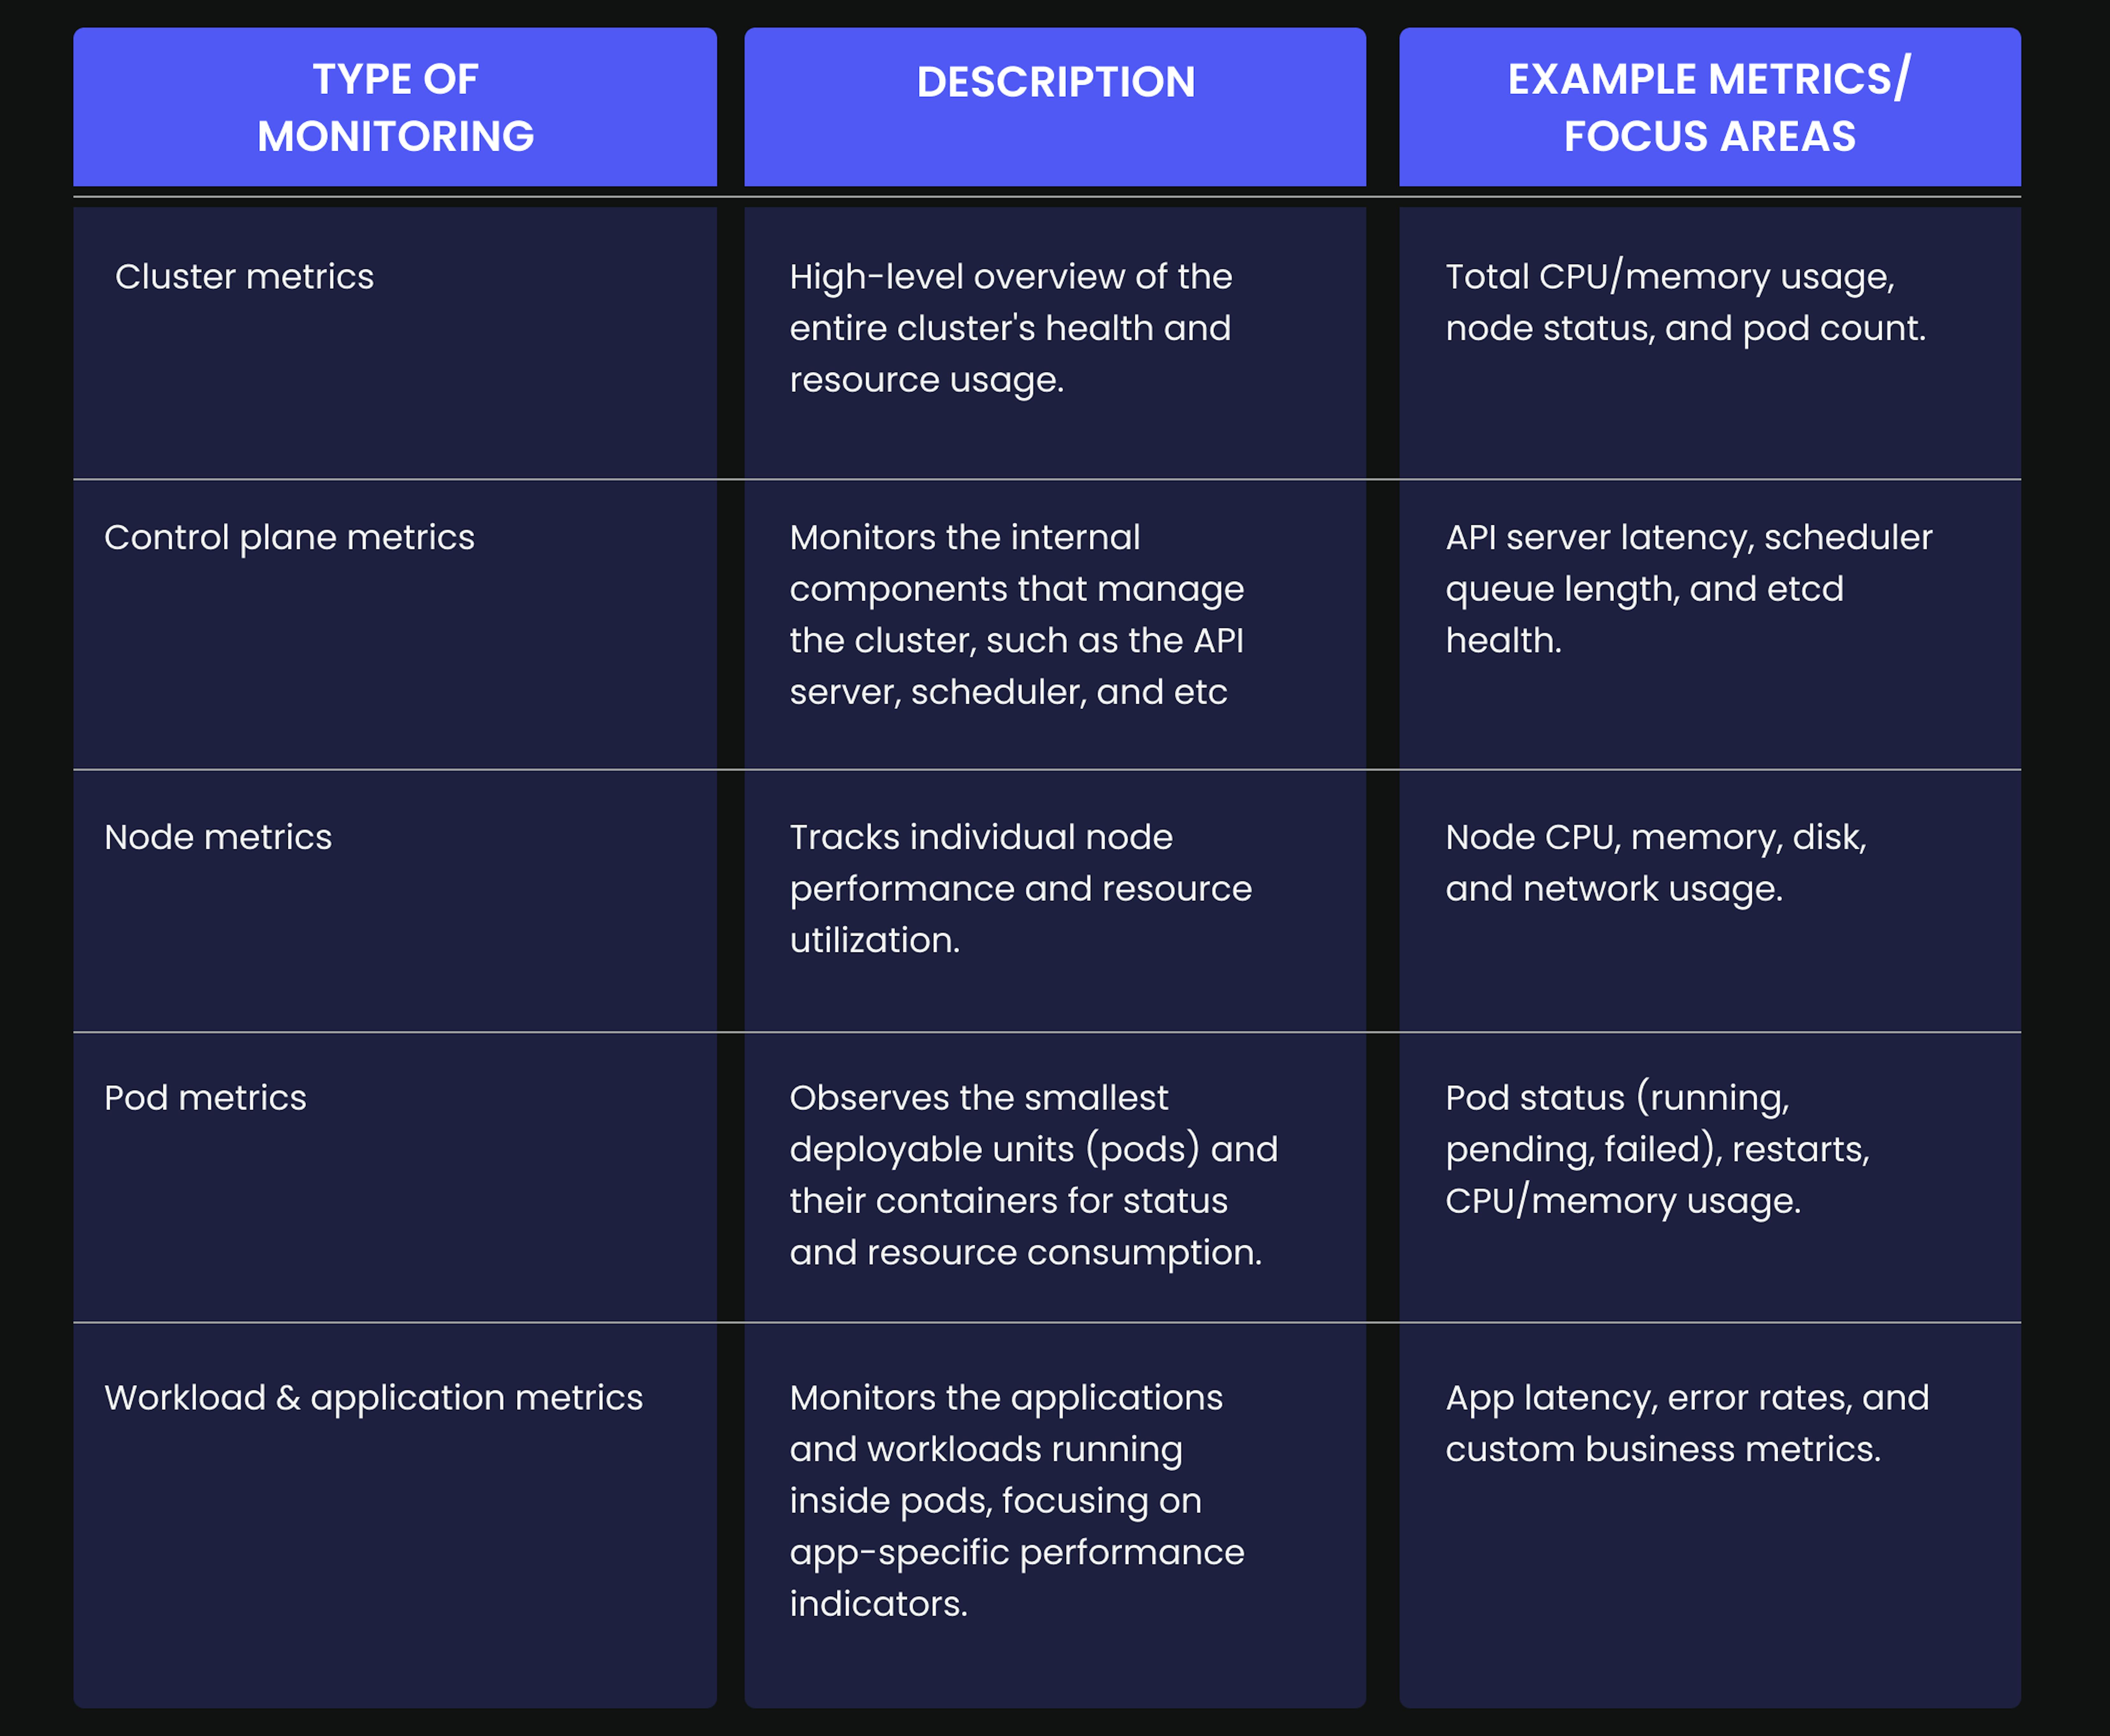
What are the types of Kubernetes monitoring?
The main types of Kubernetes monitoring can be categorized by the layer or component being observed:
Why is Kubernetes monitoring so complex?
Monitoring Kubernetes is more challenging than traditional systems due to its dynamic, distributed, and highly abstracted nature. Several core factors contribute to this complexity:
- Dynamic workloads — Pods and containers are constantly starting, stopping, and moving across nodes, making it difficult to track metrics and logs over time. Traditional tools often miss short-lived components.
- Too much data — Kubernetes generates massive amounts of granular data across many dimensions (pods, containers, labels, namespaces). This can overwhelm storage and slow down analysis.
- Distributed microservices architecture — Applications are broken into many microservices that run across different pods and nodes. Monitoring must trace and connect these services, which is far more complex than monitoring monolithic systems.
- Multi-cluster and hybrid environments — Many organizations run multiple clusters across clouds or regions. Bringing all the monitoring data together and keeping context is a major challenge.
- Resource overhead — Some monitoring tools consume significant CPU and memory, which can affect application performance, especially in smaller clusters.
- Complex configurations and abstractions — Kubernetes relies on YAML, custom resources, and layers of abstraction that can be difficult to monitor for correctness, especially for less experienced teams.
- Fragmented telemetry data — Logs, metrics, traces, and other monitoring data often live in different tools, making it hard to get a complete picture of system health.
To monitor Kubernetes effectively, teams need purpose-built tools and practices that can handle its scale, complexity, and rapid changes in real time.
What are Kubernetes monitoring best practices?
To effectively monitor Kubernetes, you need full visibility, smart alerting, and tools that can handle fast-changing environments. These 10 best practices help ensure your system stays healthy and reliable:
- Monitor every layer
Track metrics at the infrastructure level (CPU, memory), the Kubernetes platform (API server, scheduler), and the application level (error rates, traffic, latency). You need both big-picture and detailed views to spot problems quickly. - Focus on key metrics
Don't try to monitor everything. Prioritize metrics that directly impact performance and reliability, like pod health, resource usage, and app-specific KPIs. - Collect accurate, timely data
Adjust your data collection intervals based on how quickly your workloads change. Double-check data accuracy to avoid false alerts. - Use a unified monitoring platform
Centralize metrics, logs, and traces in one place for easier troubleshooting and better visibility across your stack. - Automate correlation and root cause detection
Choose tools that connect events, metrics, and logs to help you find and fix issues faster. - Monitor the Kubernetes control plane
Keep an eye on key components like the API server, kubelet, and controller manager to ensure your cluster runs smoothly. - Deploy agents with DaemonSets
Use DaemonSets to automatically install monitoring agents on every node, so data collection scales with your cluster. - Plan for scale and retention
Make sure your monitoring system can grow with your infrastructure and keep enough historical data for audits and long-term analysis. - Set up smart alerts
Set up intelligent alerting rules that reduce noise and highlight critical issues. Use anomaly detection where possible to catch problems earlier and avoid alert fatigue. - Secure your monitoring setup
Apply role-based access control (RBAC) to your monitoring tools, ensuring that only authorized users can view or modify sensitive telemetry data. This protects your systems and supports compliance.
How Mad Devs can help you with Kubernetes monitoring?
Kubernetes monitoring is not just about installing tools. It's about ensuring consistent, actionable insights across a dynamic environment. Mad Devs provides comprehensive Kubernetes services with certified specialists and proven methodologies. We help teams implement scalable monitoring systems, fine-tune metrics, set up intelligent alerting, and correlate logs, traces, and metrics in real time.
Key Takeaways
- Kubernetes monitoring tracks the health, performance, and resource use of containerized environments to help teams catch issues early and keep clusters running smoothly.
- It covers everything from node and pod metrics to control plane and app performance.
- Because workloads constantly shift and data is high-volume and distributed, monitoring Kubernetes is more complex than traditional systems.
- Best practices include monitoring every layer, focusing on critical metrics, unifying logs and traces, automating alerting and root cause detection, and using scalable tools.
