


Analyze with AI
Get AI-powered insights from this Mad Devs article:
My story of interacting with Glitch.com began not so long ago, but in this short time, I really come to love this coolly invented service. 🥰 So, in this article, I wrote the story of my experience with glitch UI.
This project is developed and supported by the FogCreek team led by Joel Spolsky, who co-founded services such as Trello and StackOverflow. Here is his blog.
This story has two parts:
- The first part (current) will discuss Glitch.com itself and its features and benefits.
- In the second part, the experience of delivering your Node.js application to glitch.com will be described in a non-standard way:
In fact, this is actually a remote workstation, with the ability to edit code, add files, and the ability to execute necessary commands in the console.
And this service stands out with its unusual and cool design. It mainly focuses on Node.js and static pages. So this is just a paradise for a JavaScript developer.
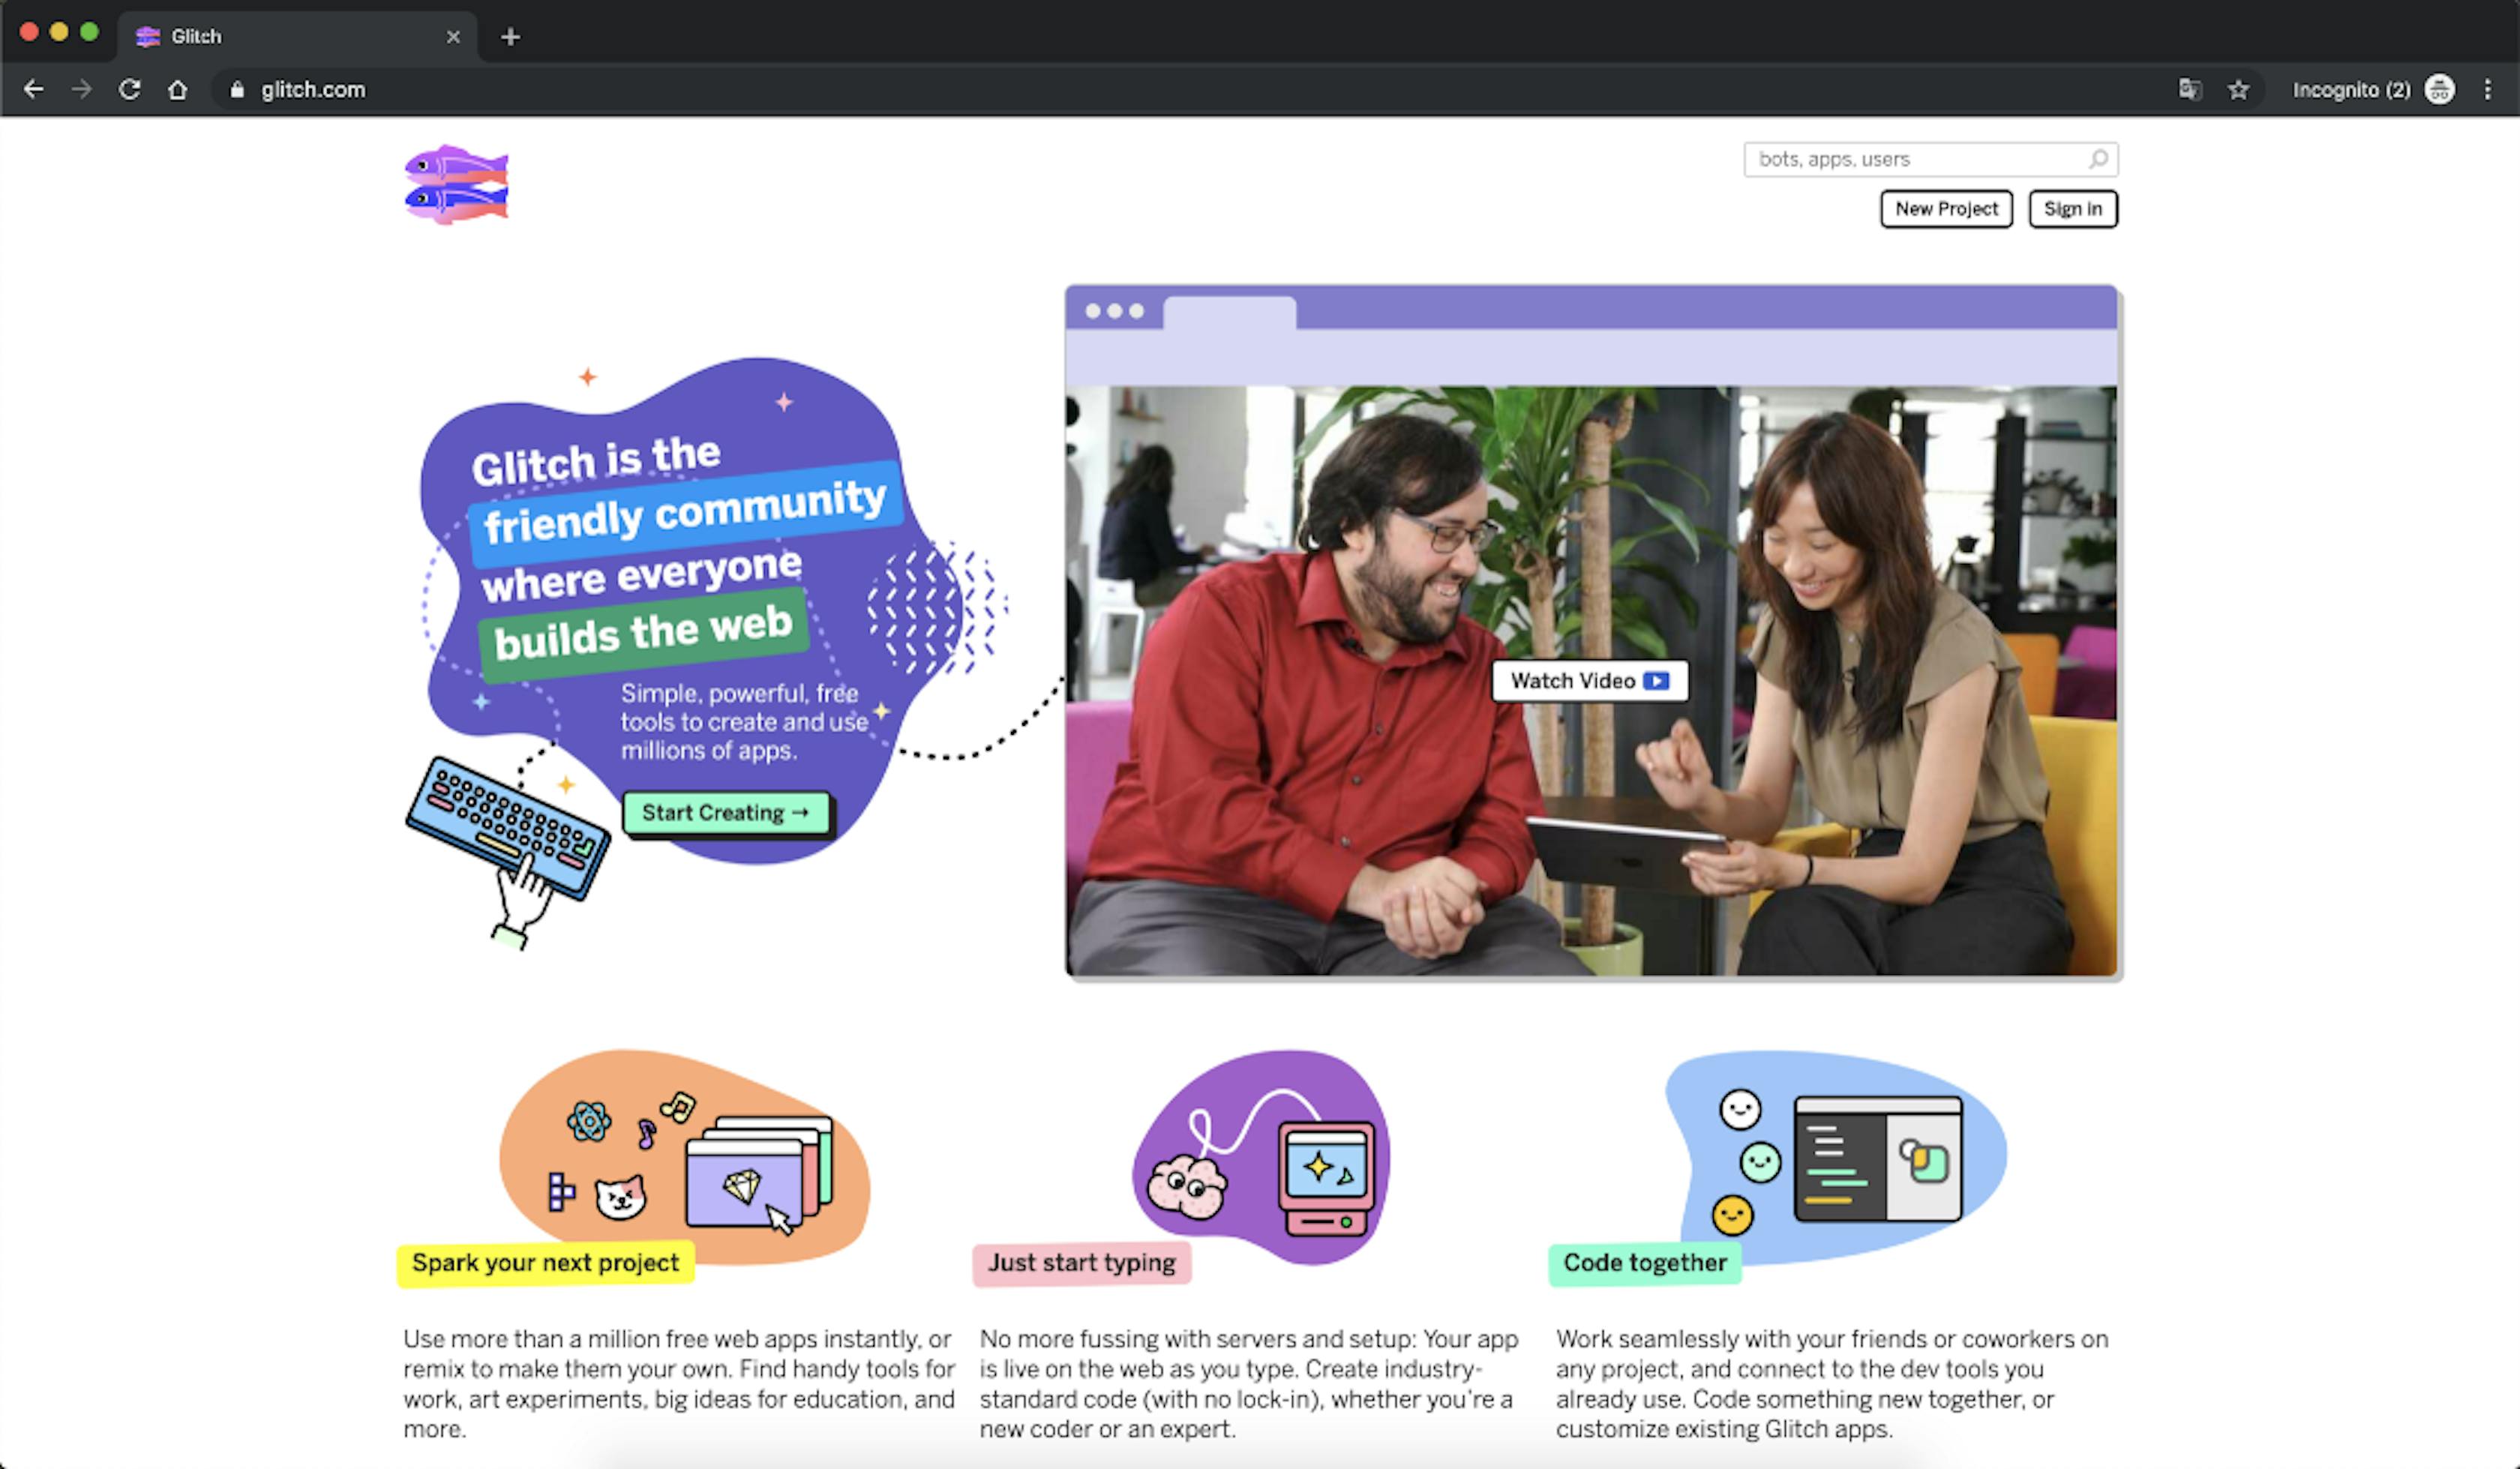
At the first visit, we are greeted by the main page, which is decorated very funny.
The following authentication types are supported:
- GitHub
- And regular login with e-mail and password.
- And there is an inconspicuous button at the bottom, "Use a sign-in code."
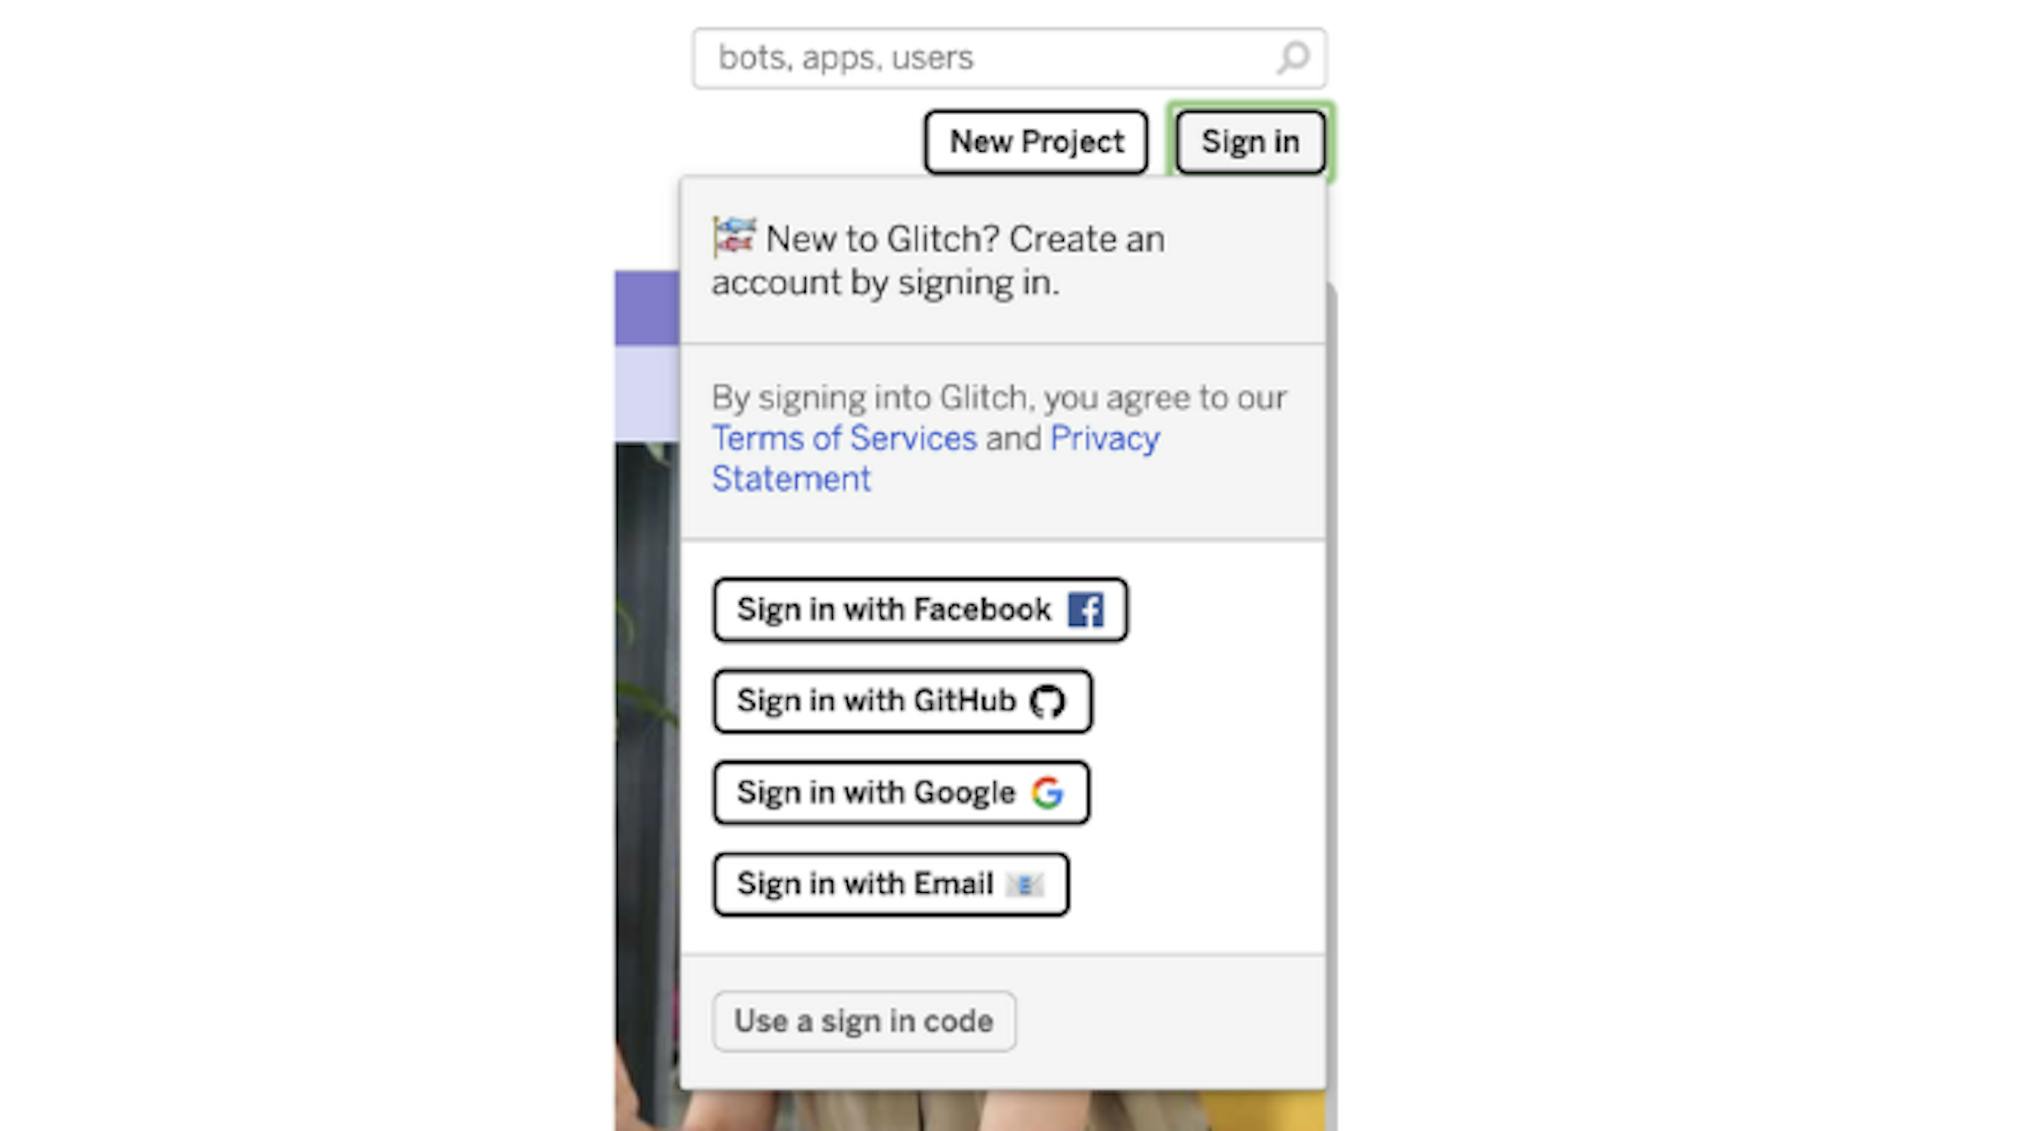
Which way to choose is up to you. For the developer, of course, it is more convenient to use the input through GitHub.
In general, this service impressed me with the fact that it provides enough resources for your web application, and the console most impressed me. And now let's talk about the important components of this service.
About UI
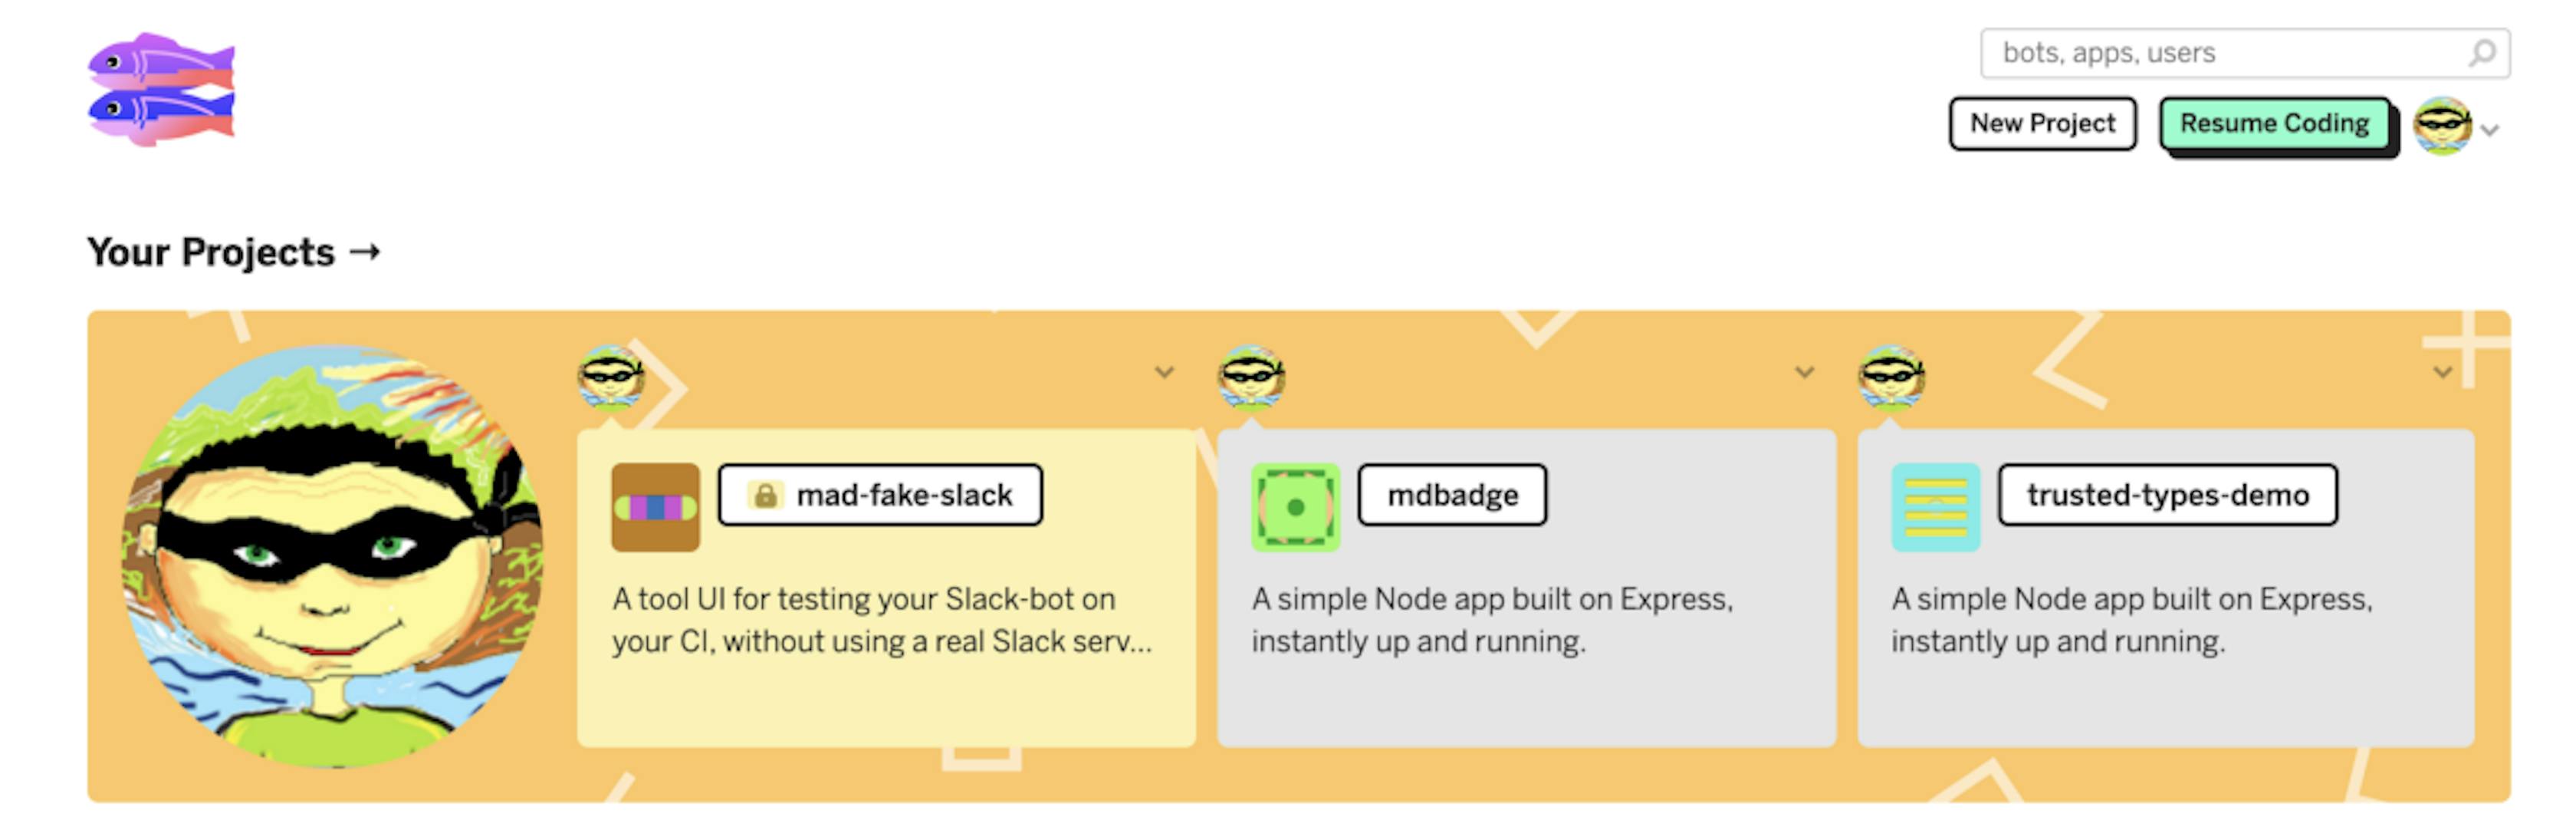
After entering your account, if your projects are available, a list is displayed from which you can immediately select a project. The rest of the information about the work of other people is below. It is very convenient and does not force you to take unnecessary actions.
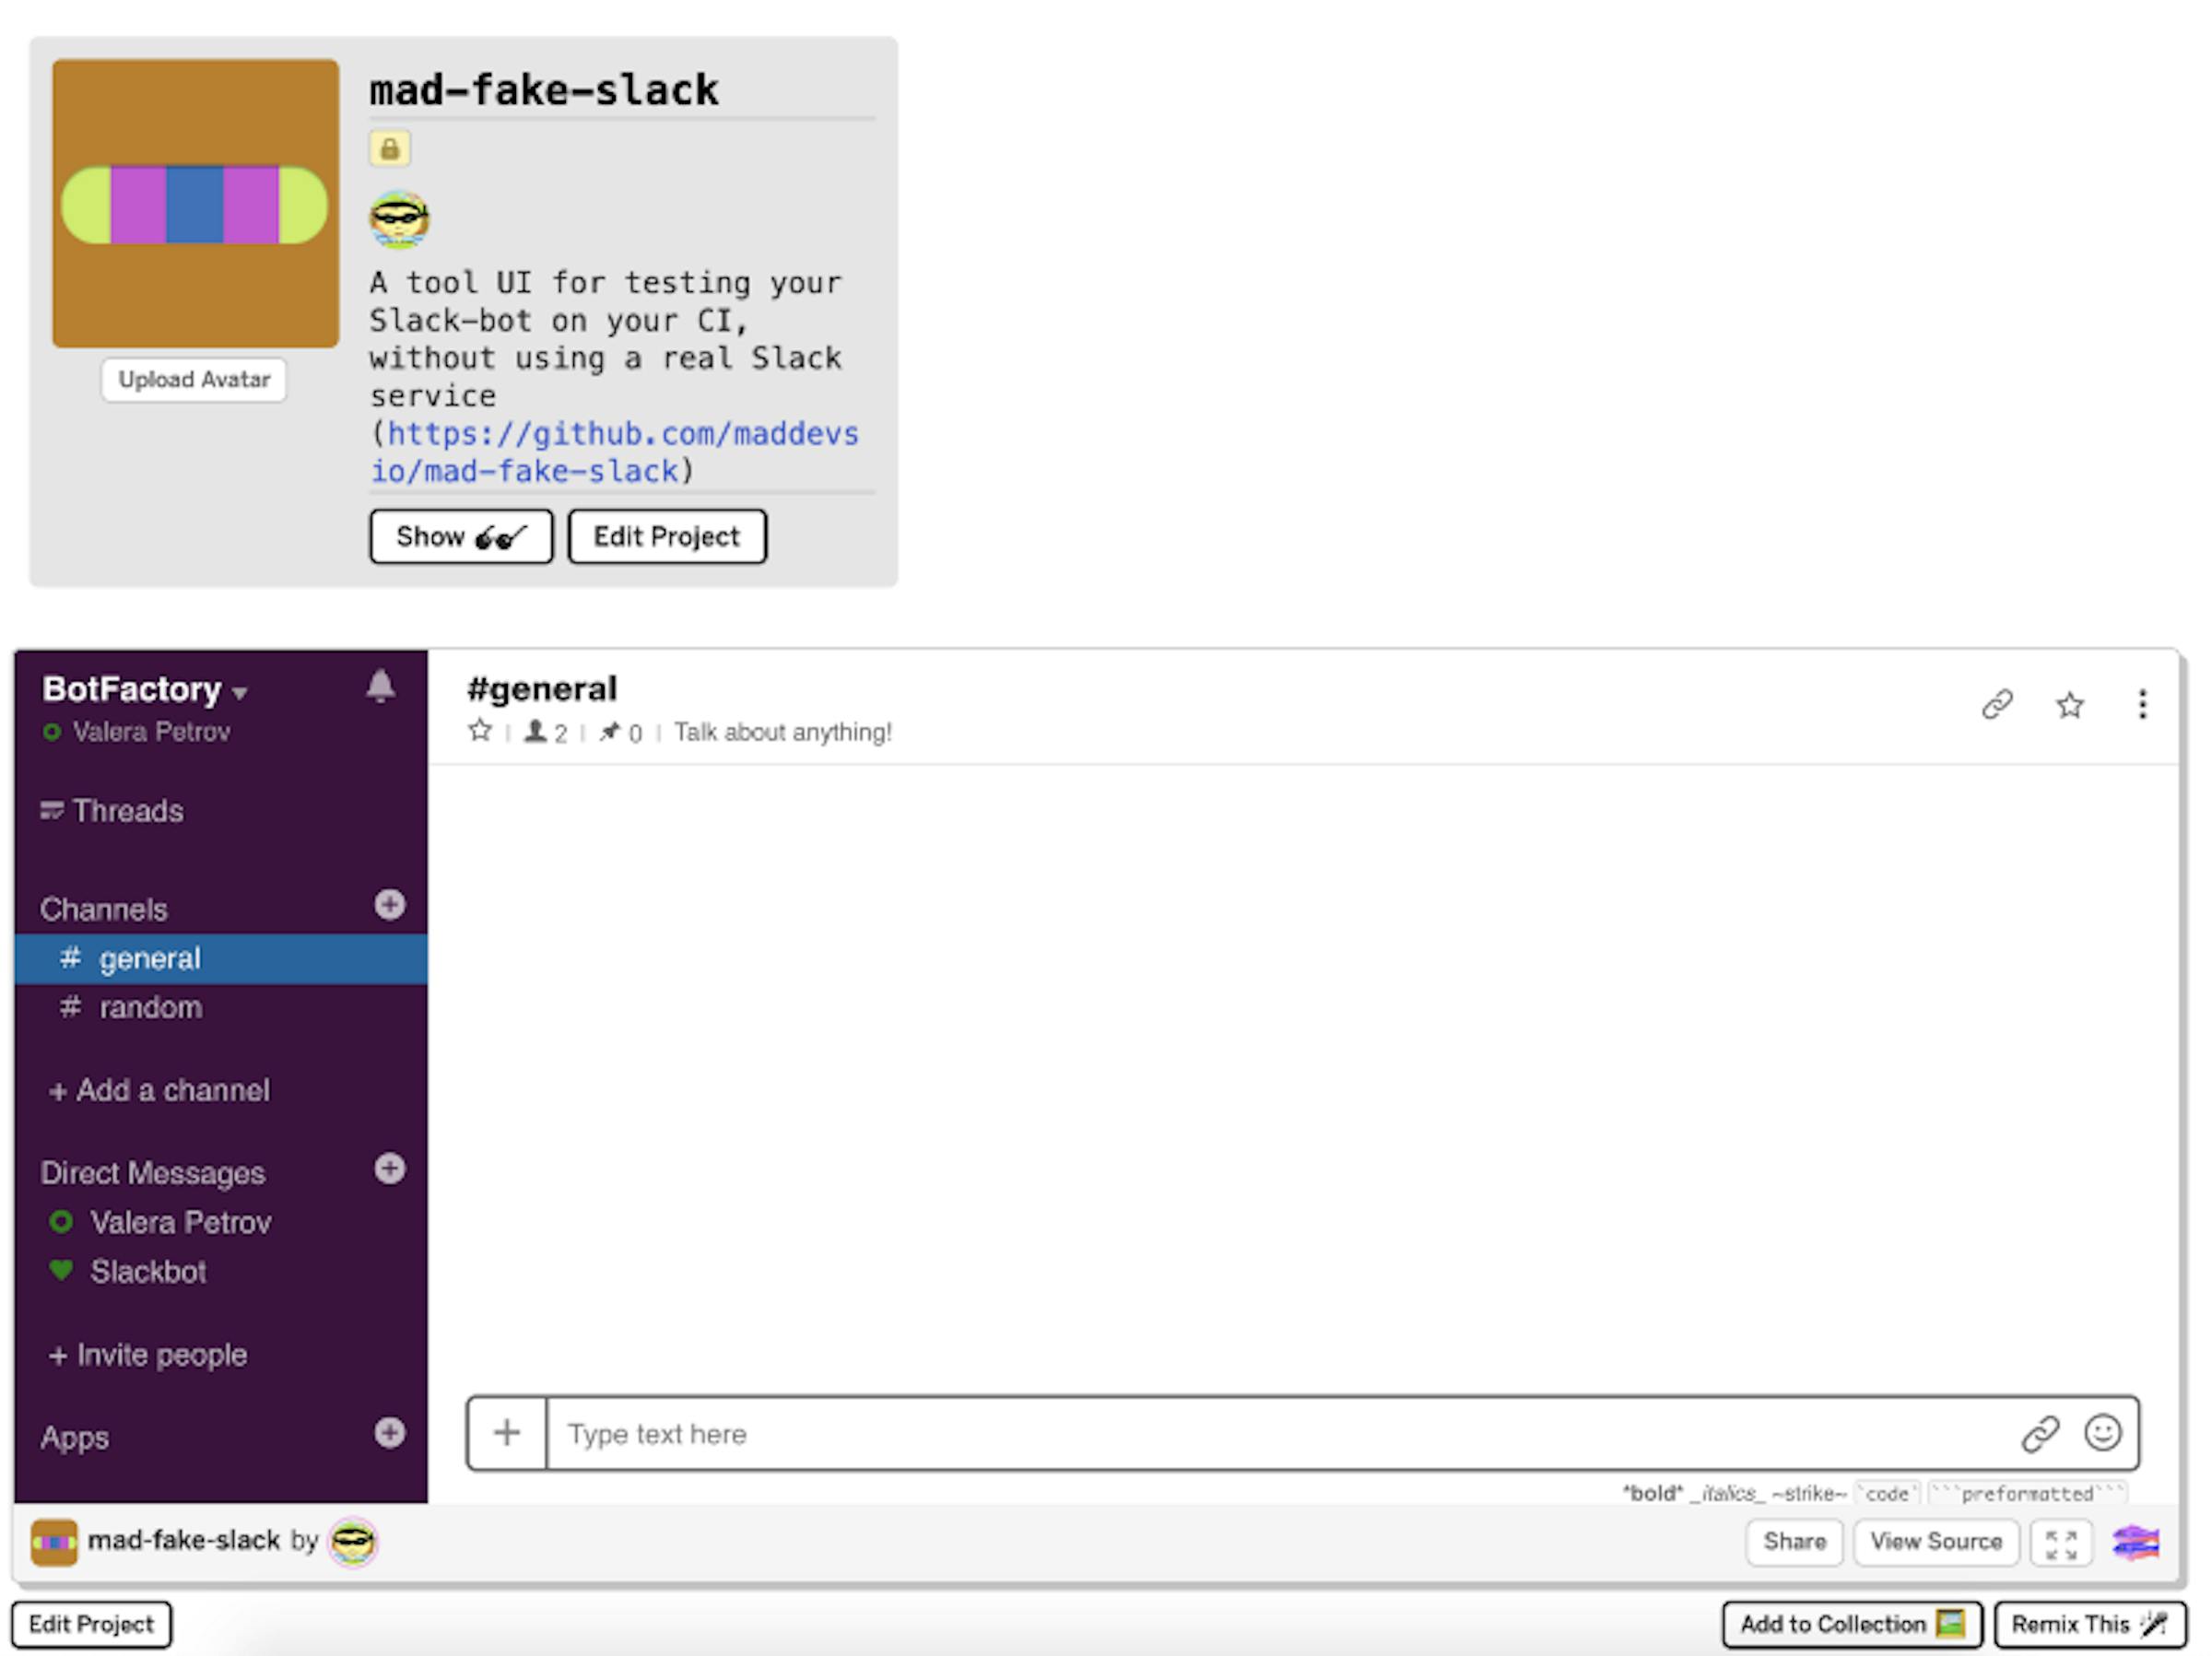
You can click on your project, and then a preview is shown to you.
You can immediately click on the buttons:
- Edit Project — to open a convenient and simple IDE in the browser, which can be reloaded after you make changes.
- Show — to open the project in a separate window for viewing, as if you were a user.
This is how the mad-fake-slack application looks, for example — if I click on Show.
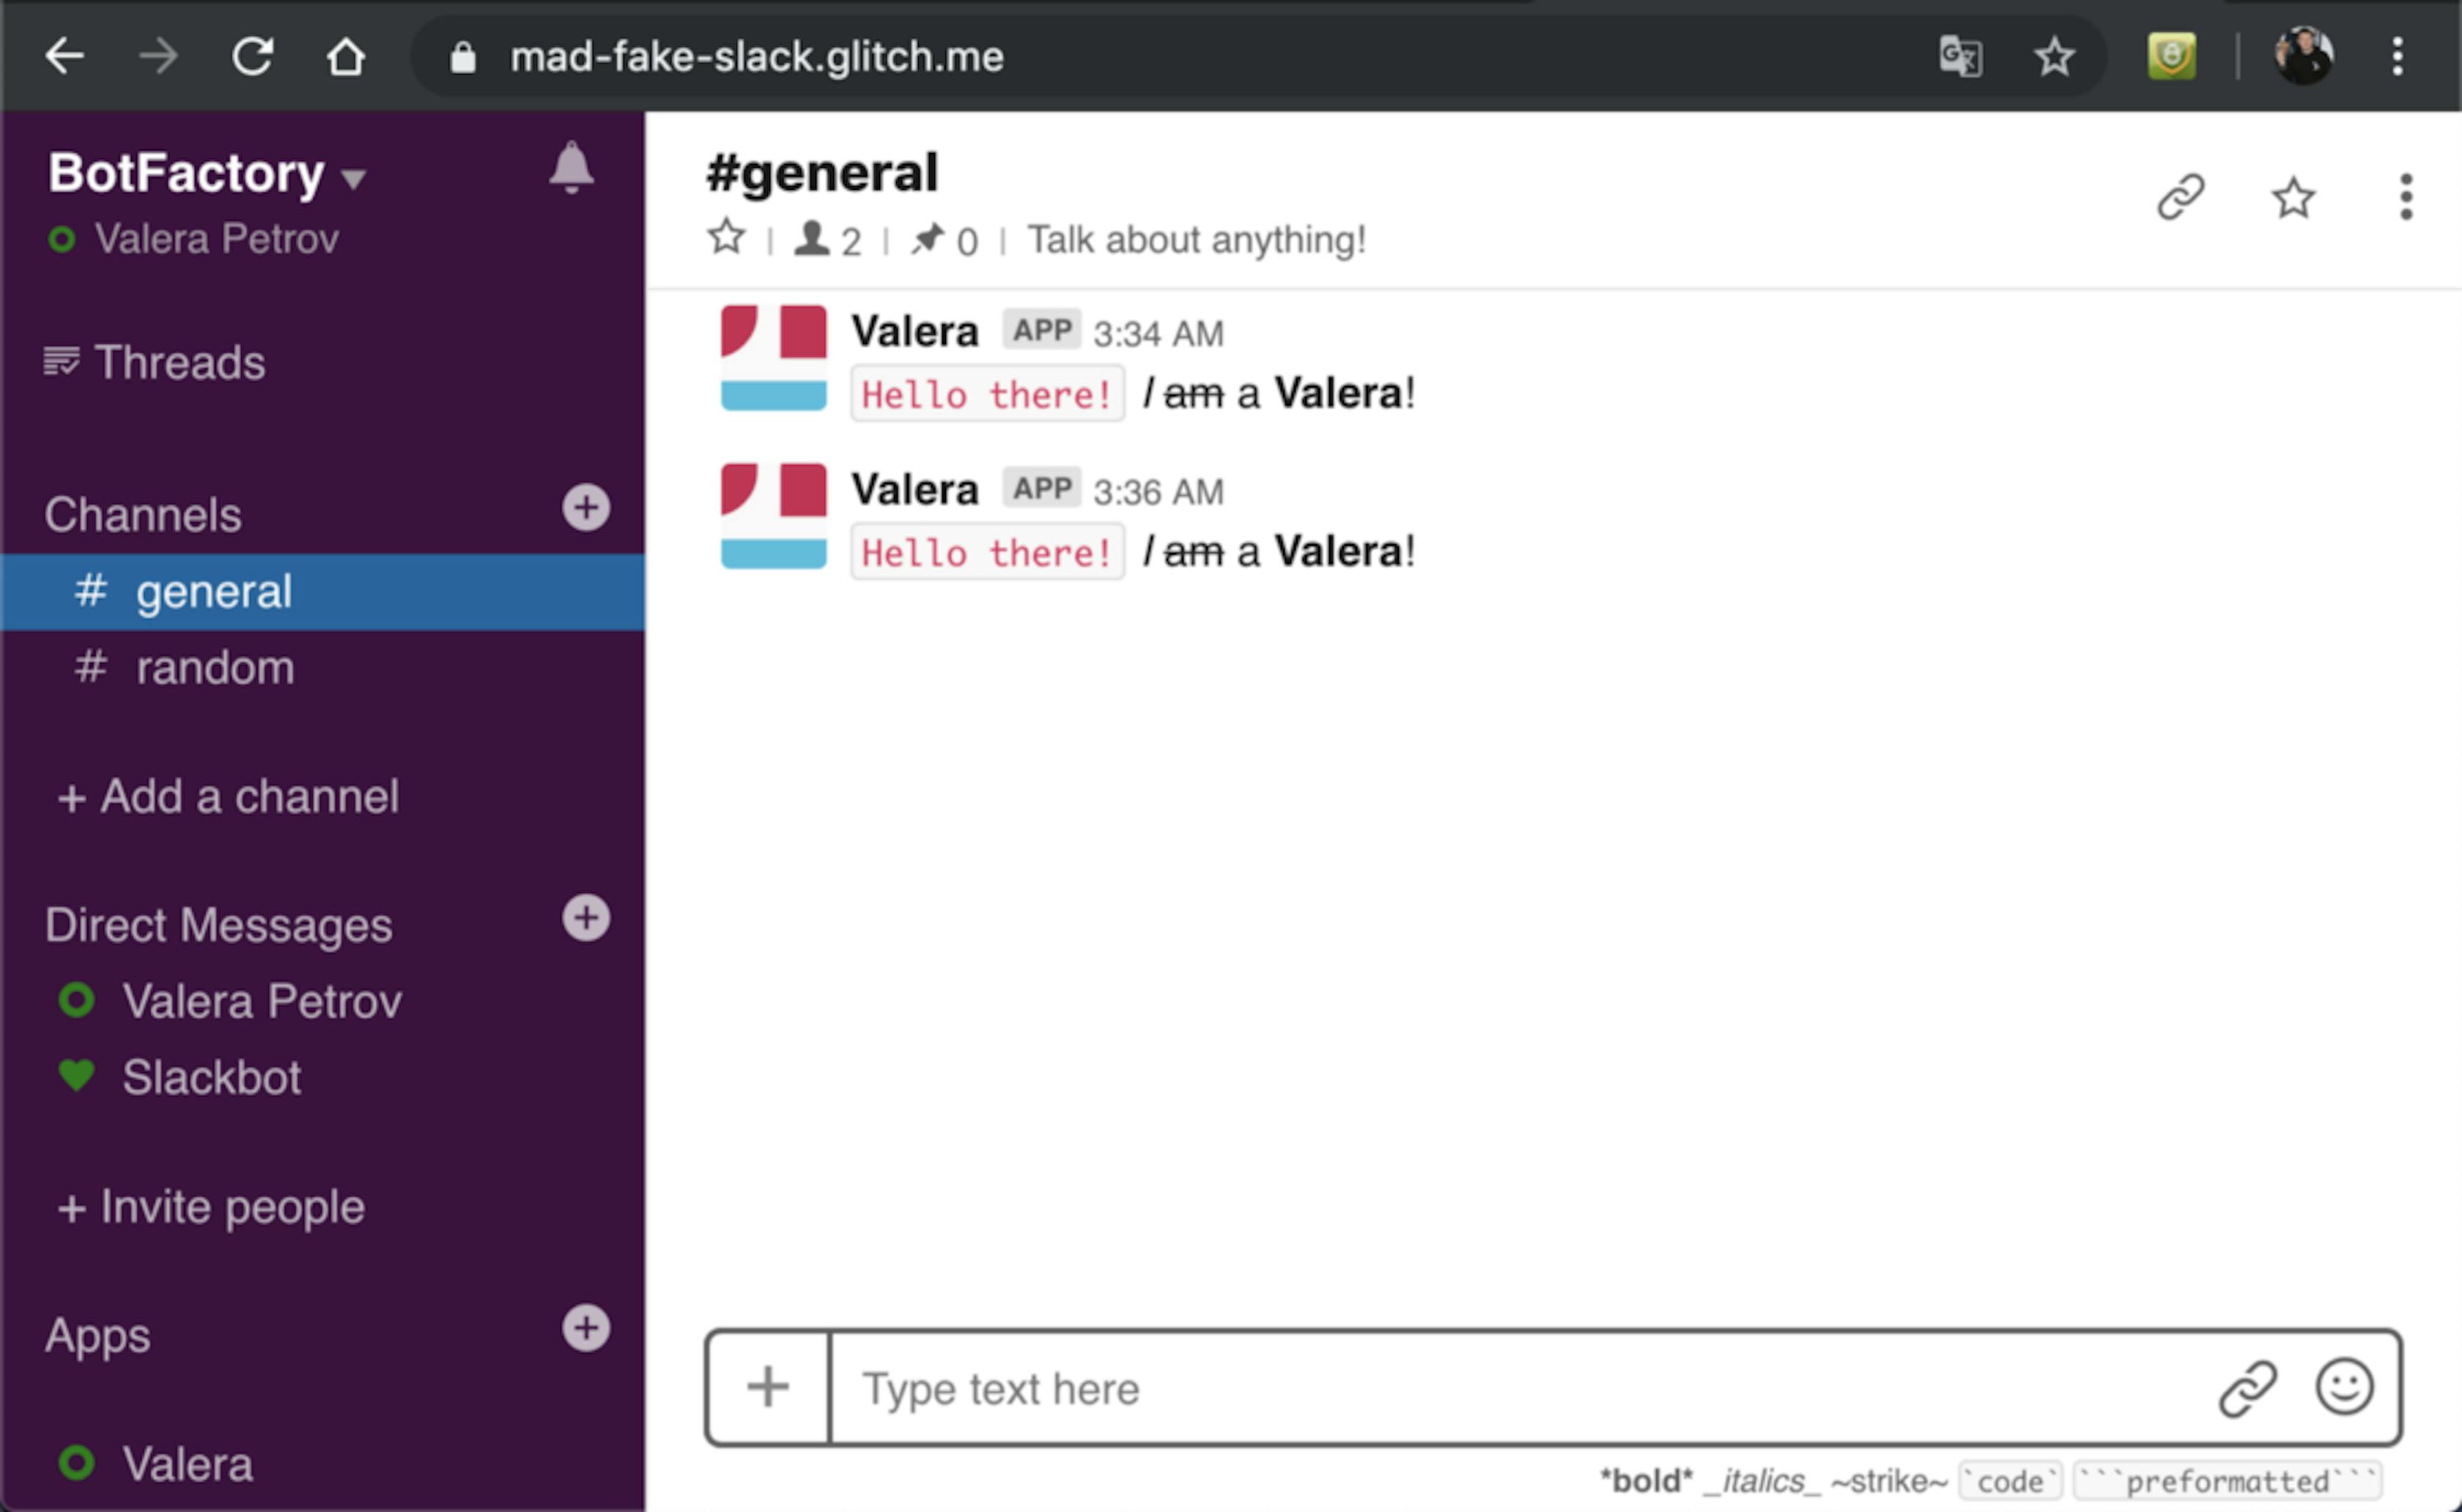
This is how the mad-fake-slack application launched on glitch.com looks like.
Well, if I click on Edit Project, then I get into a mini improvised IDE. It is very convenient for quickly fixing problems in the browser.
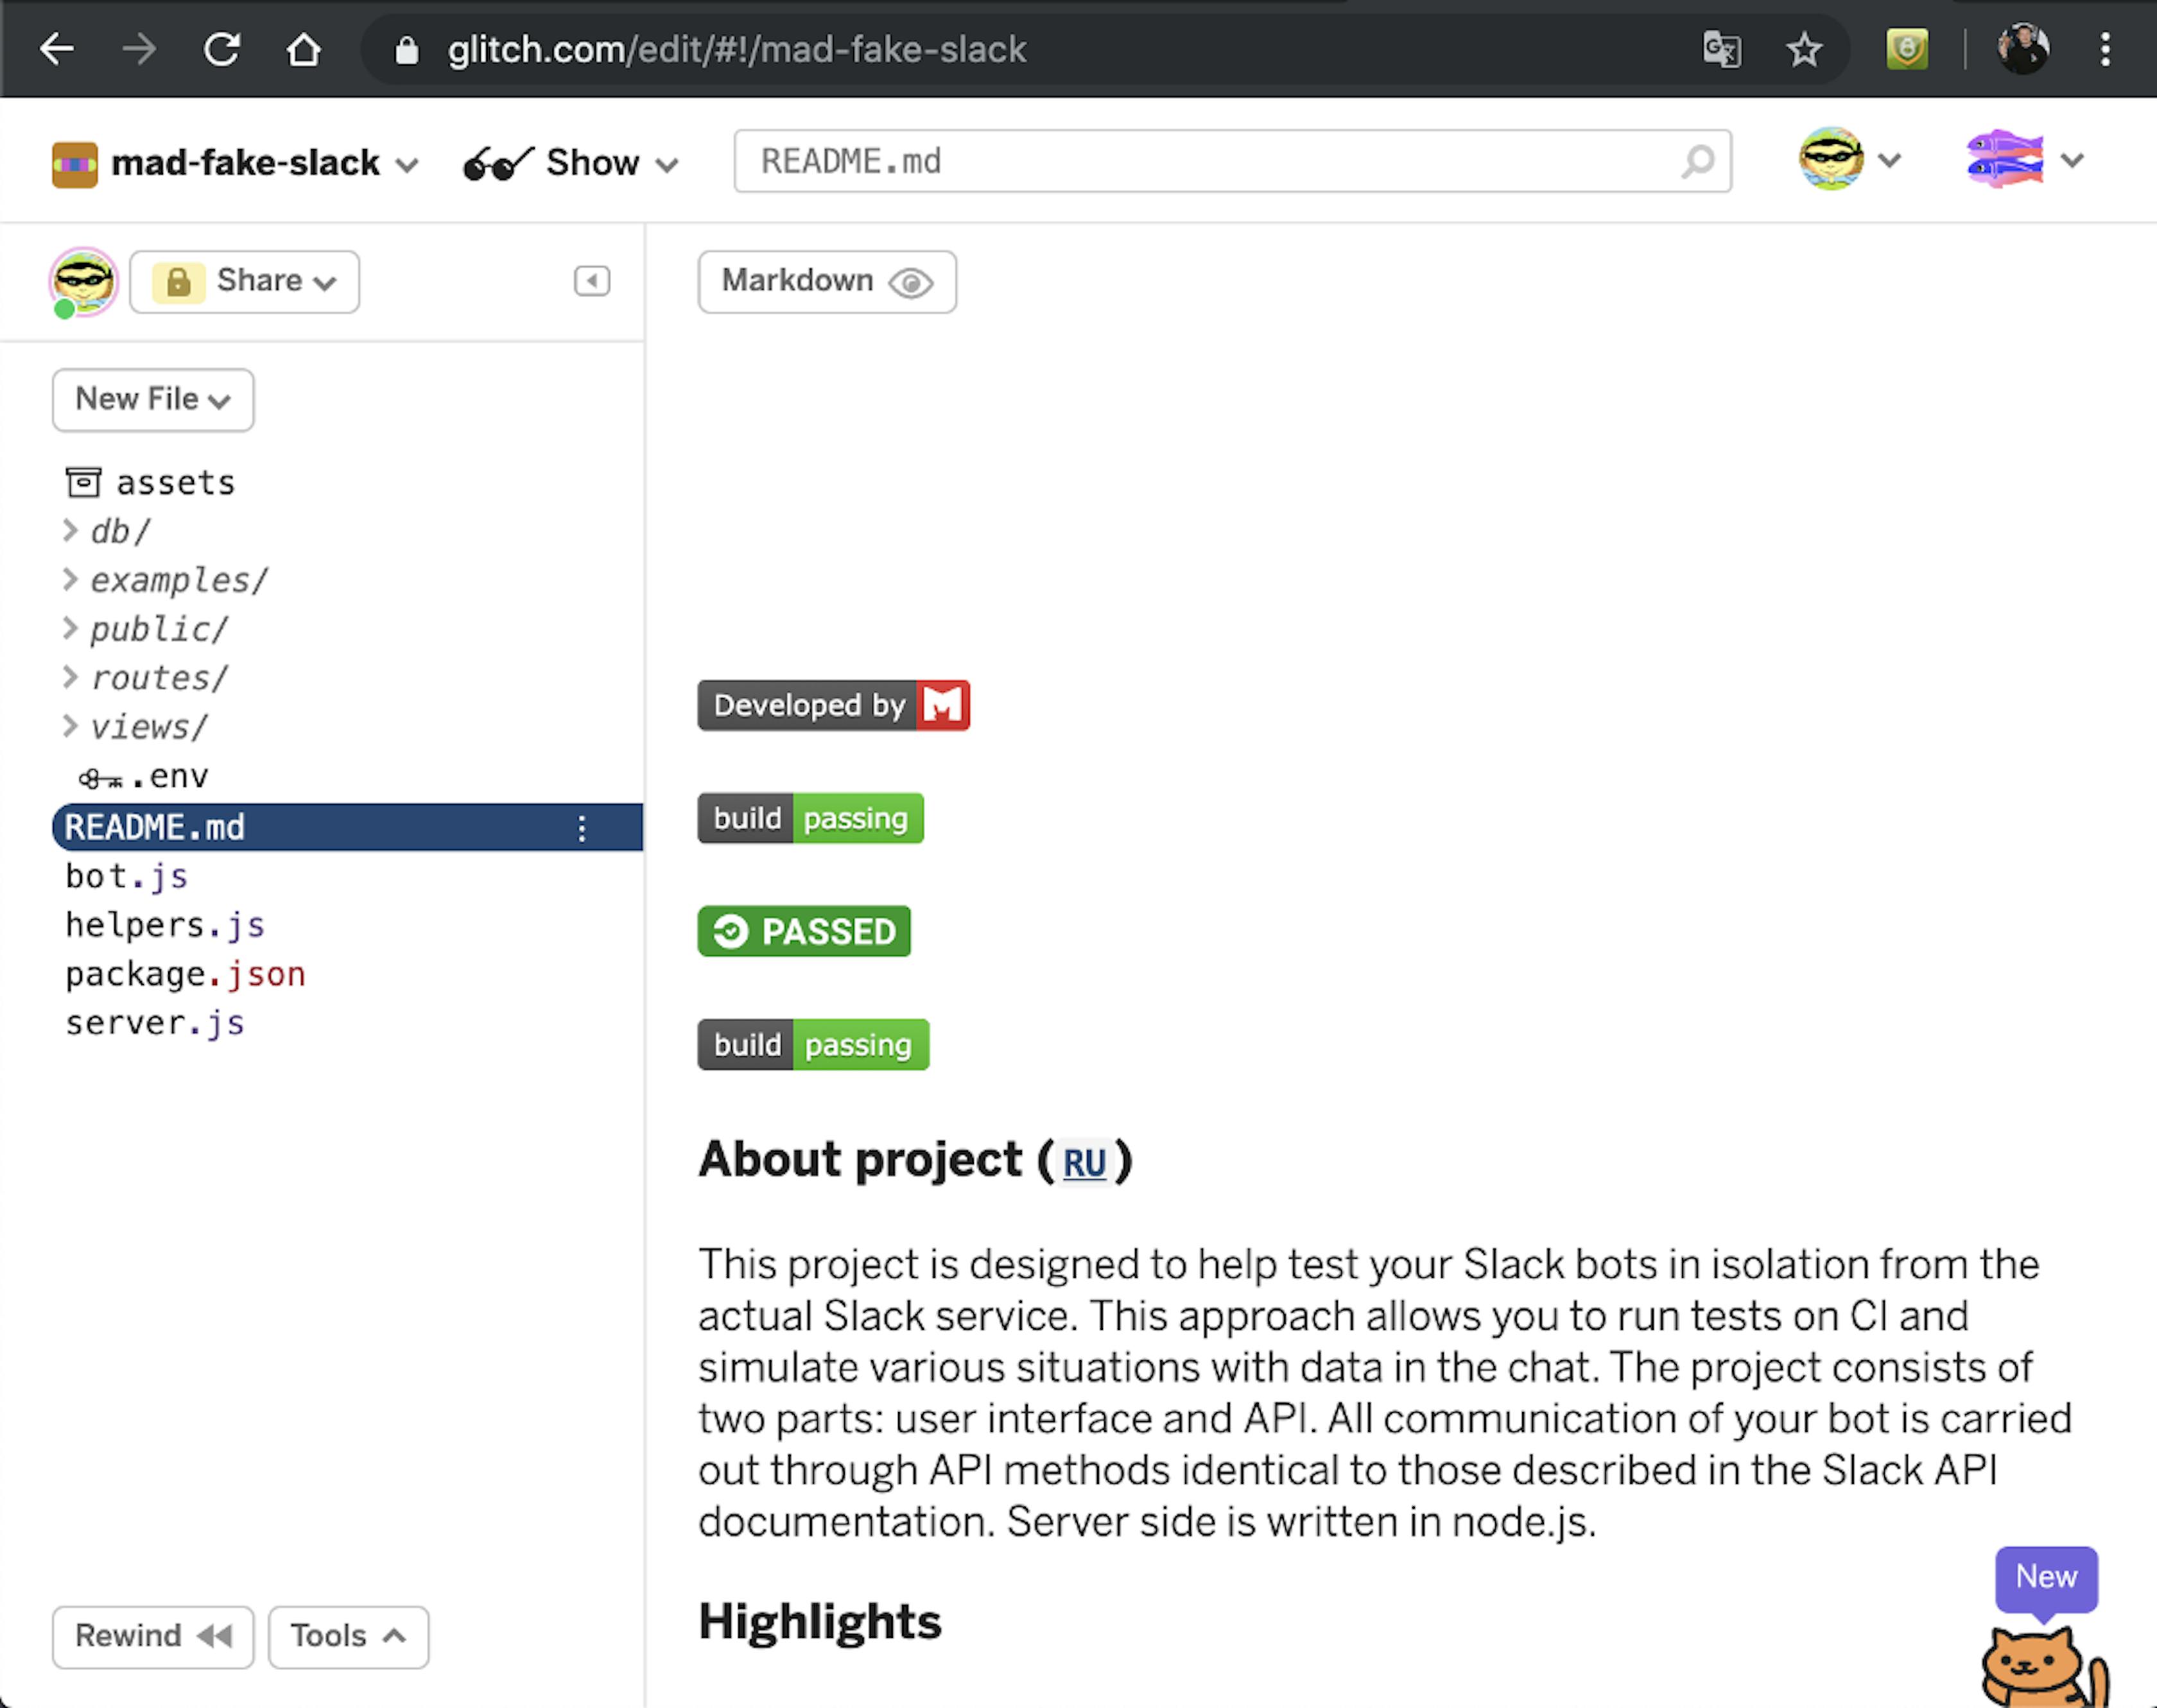
IDE view for your project
IDE Features
- View file contents.
- Upload files.
- Creating files nested in folders by specifying not only the name of the file but also the path.
- Delete files.
- To load resources, there is a special folder called "assets," which is logical. It can serve as a transshipment base — a kind of file exchanger. Next, you will see how you can take this opportunity.
- Reaction to changes allows you to see how they affect the UI of your web application.
- Very convenient notification of new packages for your dependencies
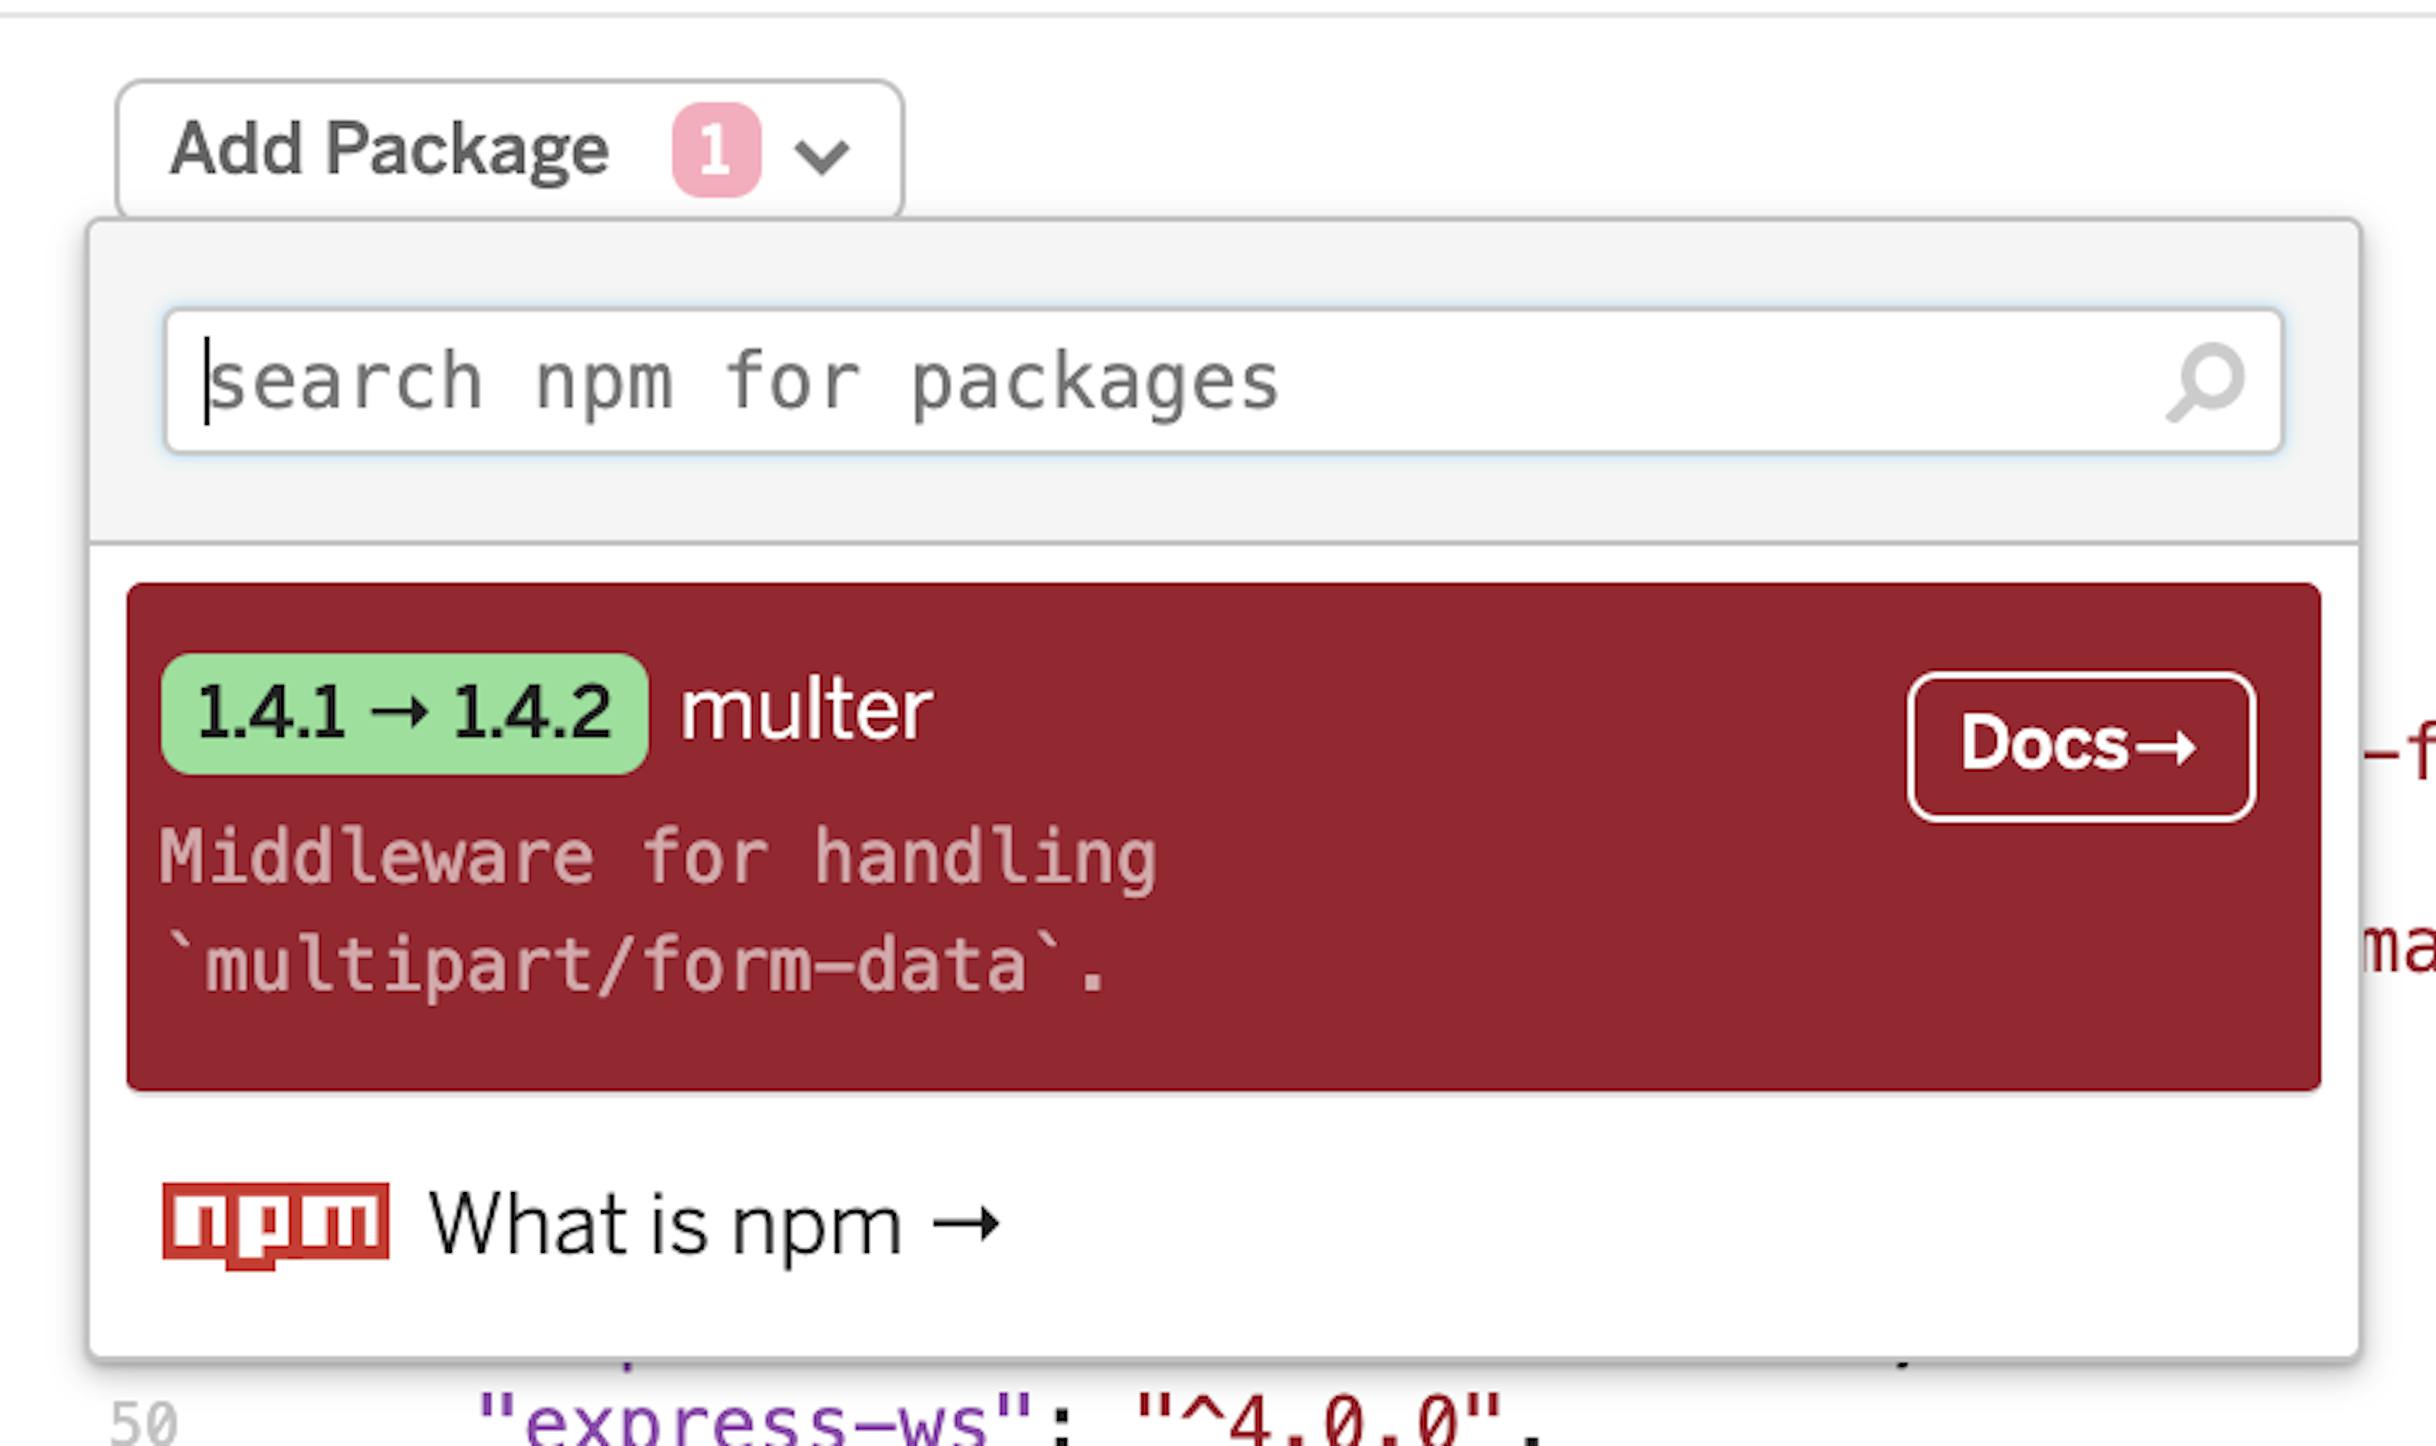
This is how convenient notification of new versions of packages comes in
There are also disadvantages in the IDE, but they are easily bypassed through the console. In the IDE, you cannot load a binary file, such as a picture or fon,t directly into the desired folder; all downloaded files will be placed in the "assets" folder. But as I said, this is not a problem.
Metrics available at IDE
How about metrics? They are very important since all your web products run in the container. And I will tell you honestly, they really saved me, because the Node.js library for @slack/rtm-apigets crazy if it tries to connect to an address that is not listened to by any service, which leads to processor loading at 80%. I think it would be difficult to notice if there were no container status.
This is how the container status looks in the interface:
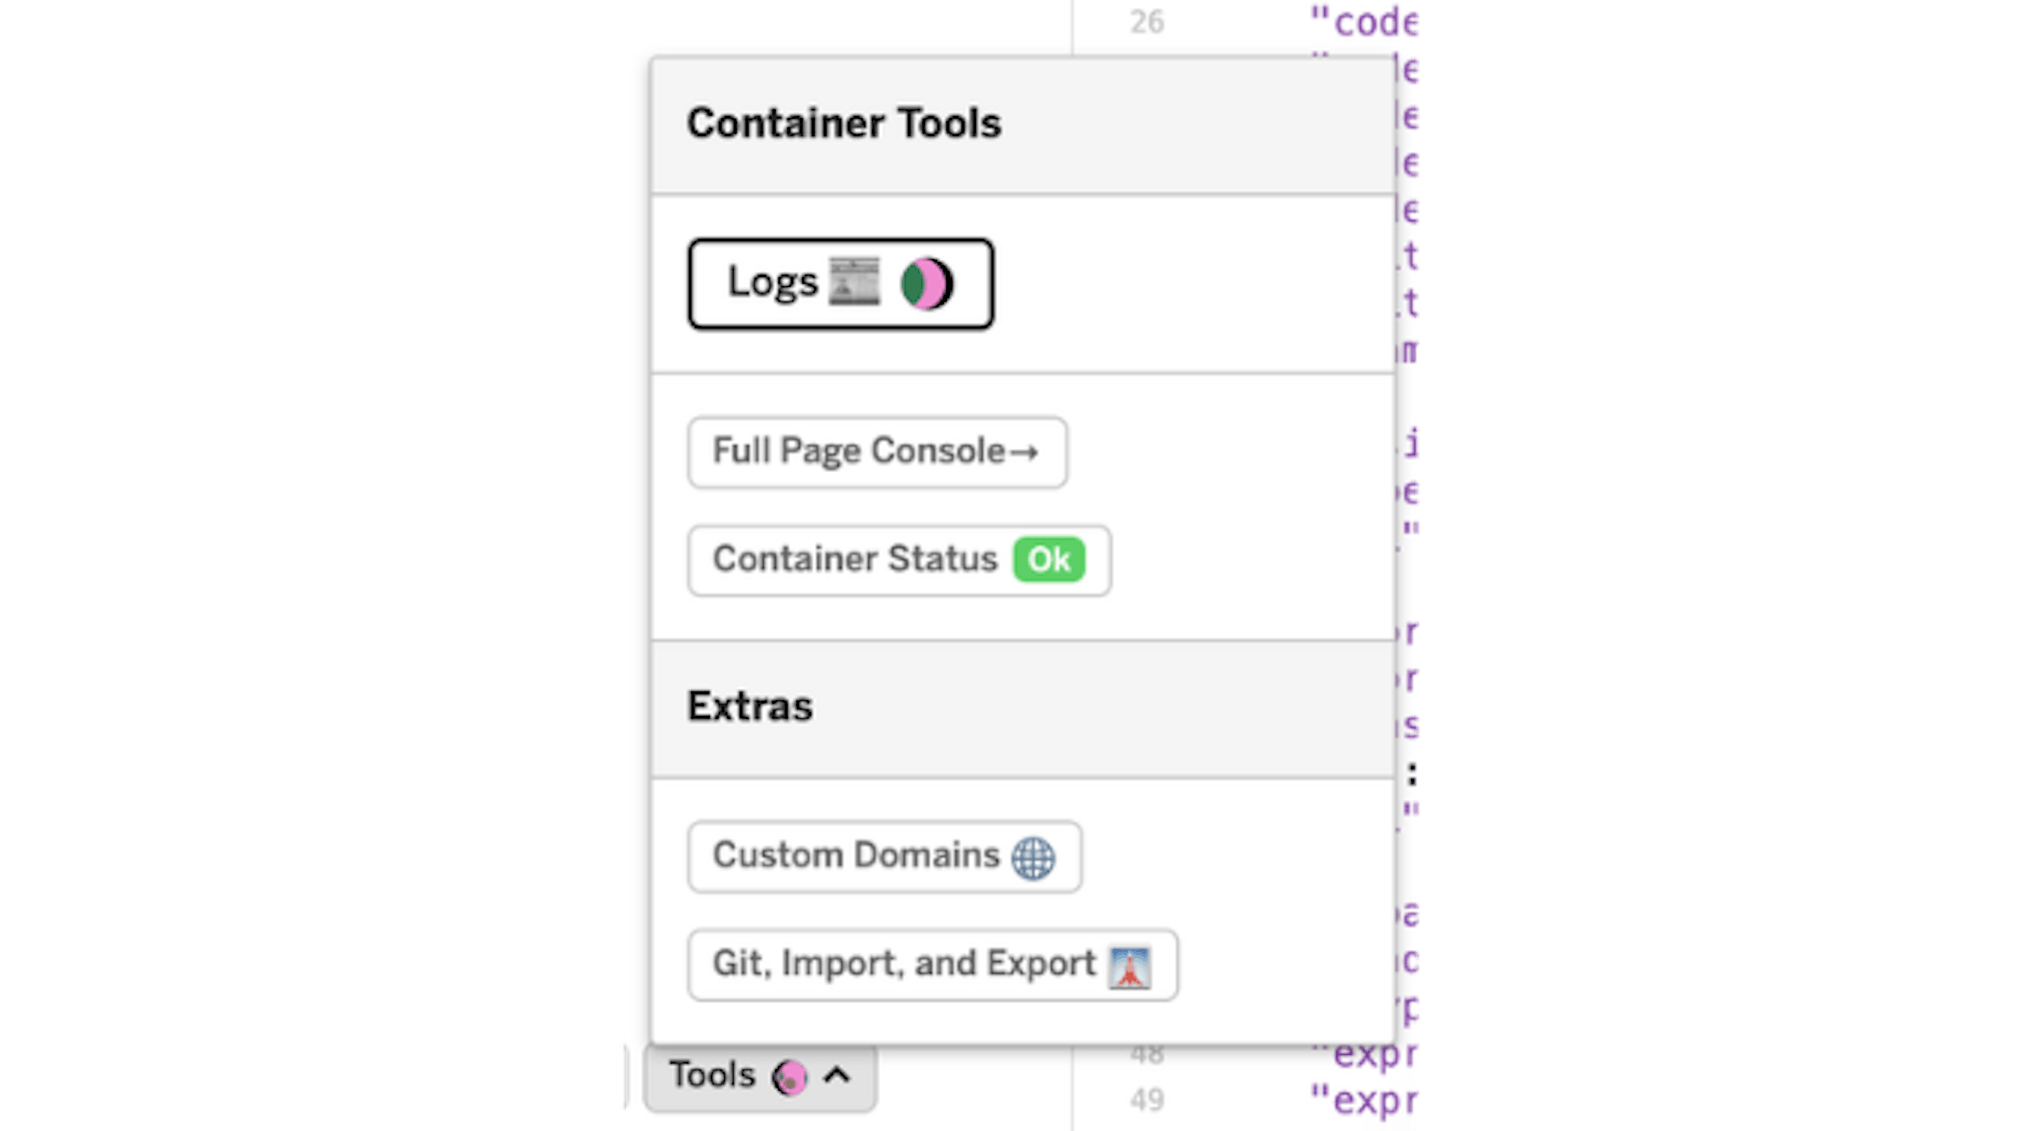
It is hidden in the Tools menu and does not bother you, but as soon as something goes wrong, you will receive a notification directly in the IDE. By clicking on Container Status, you will see the following section:
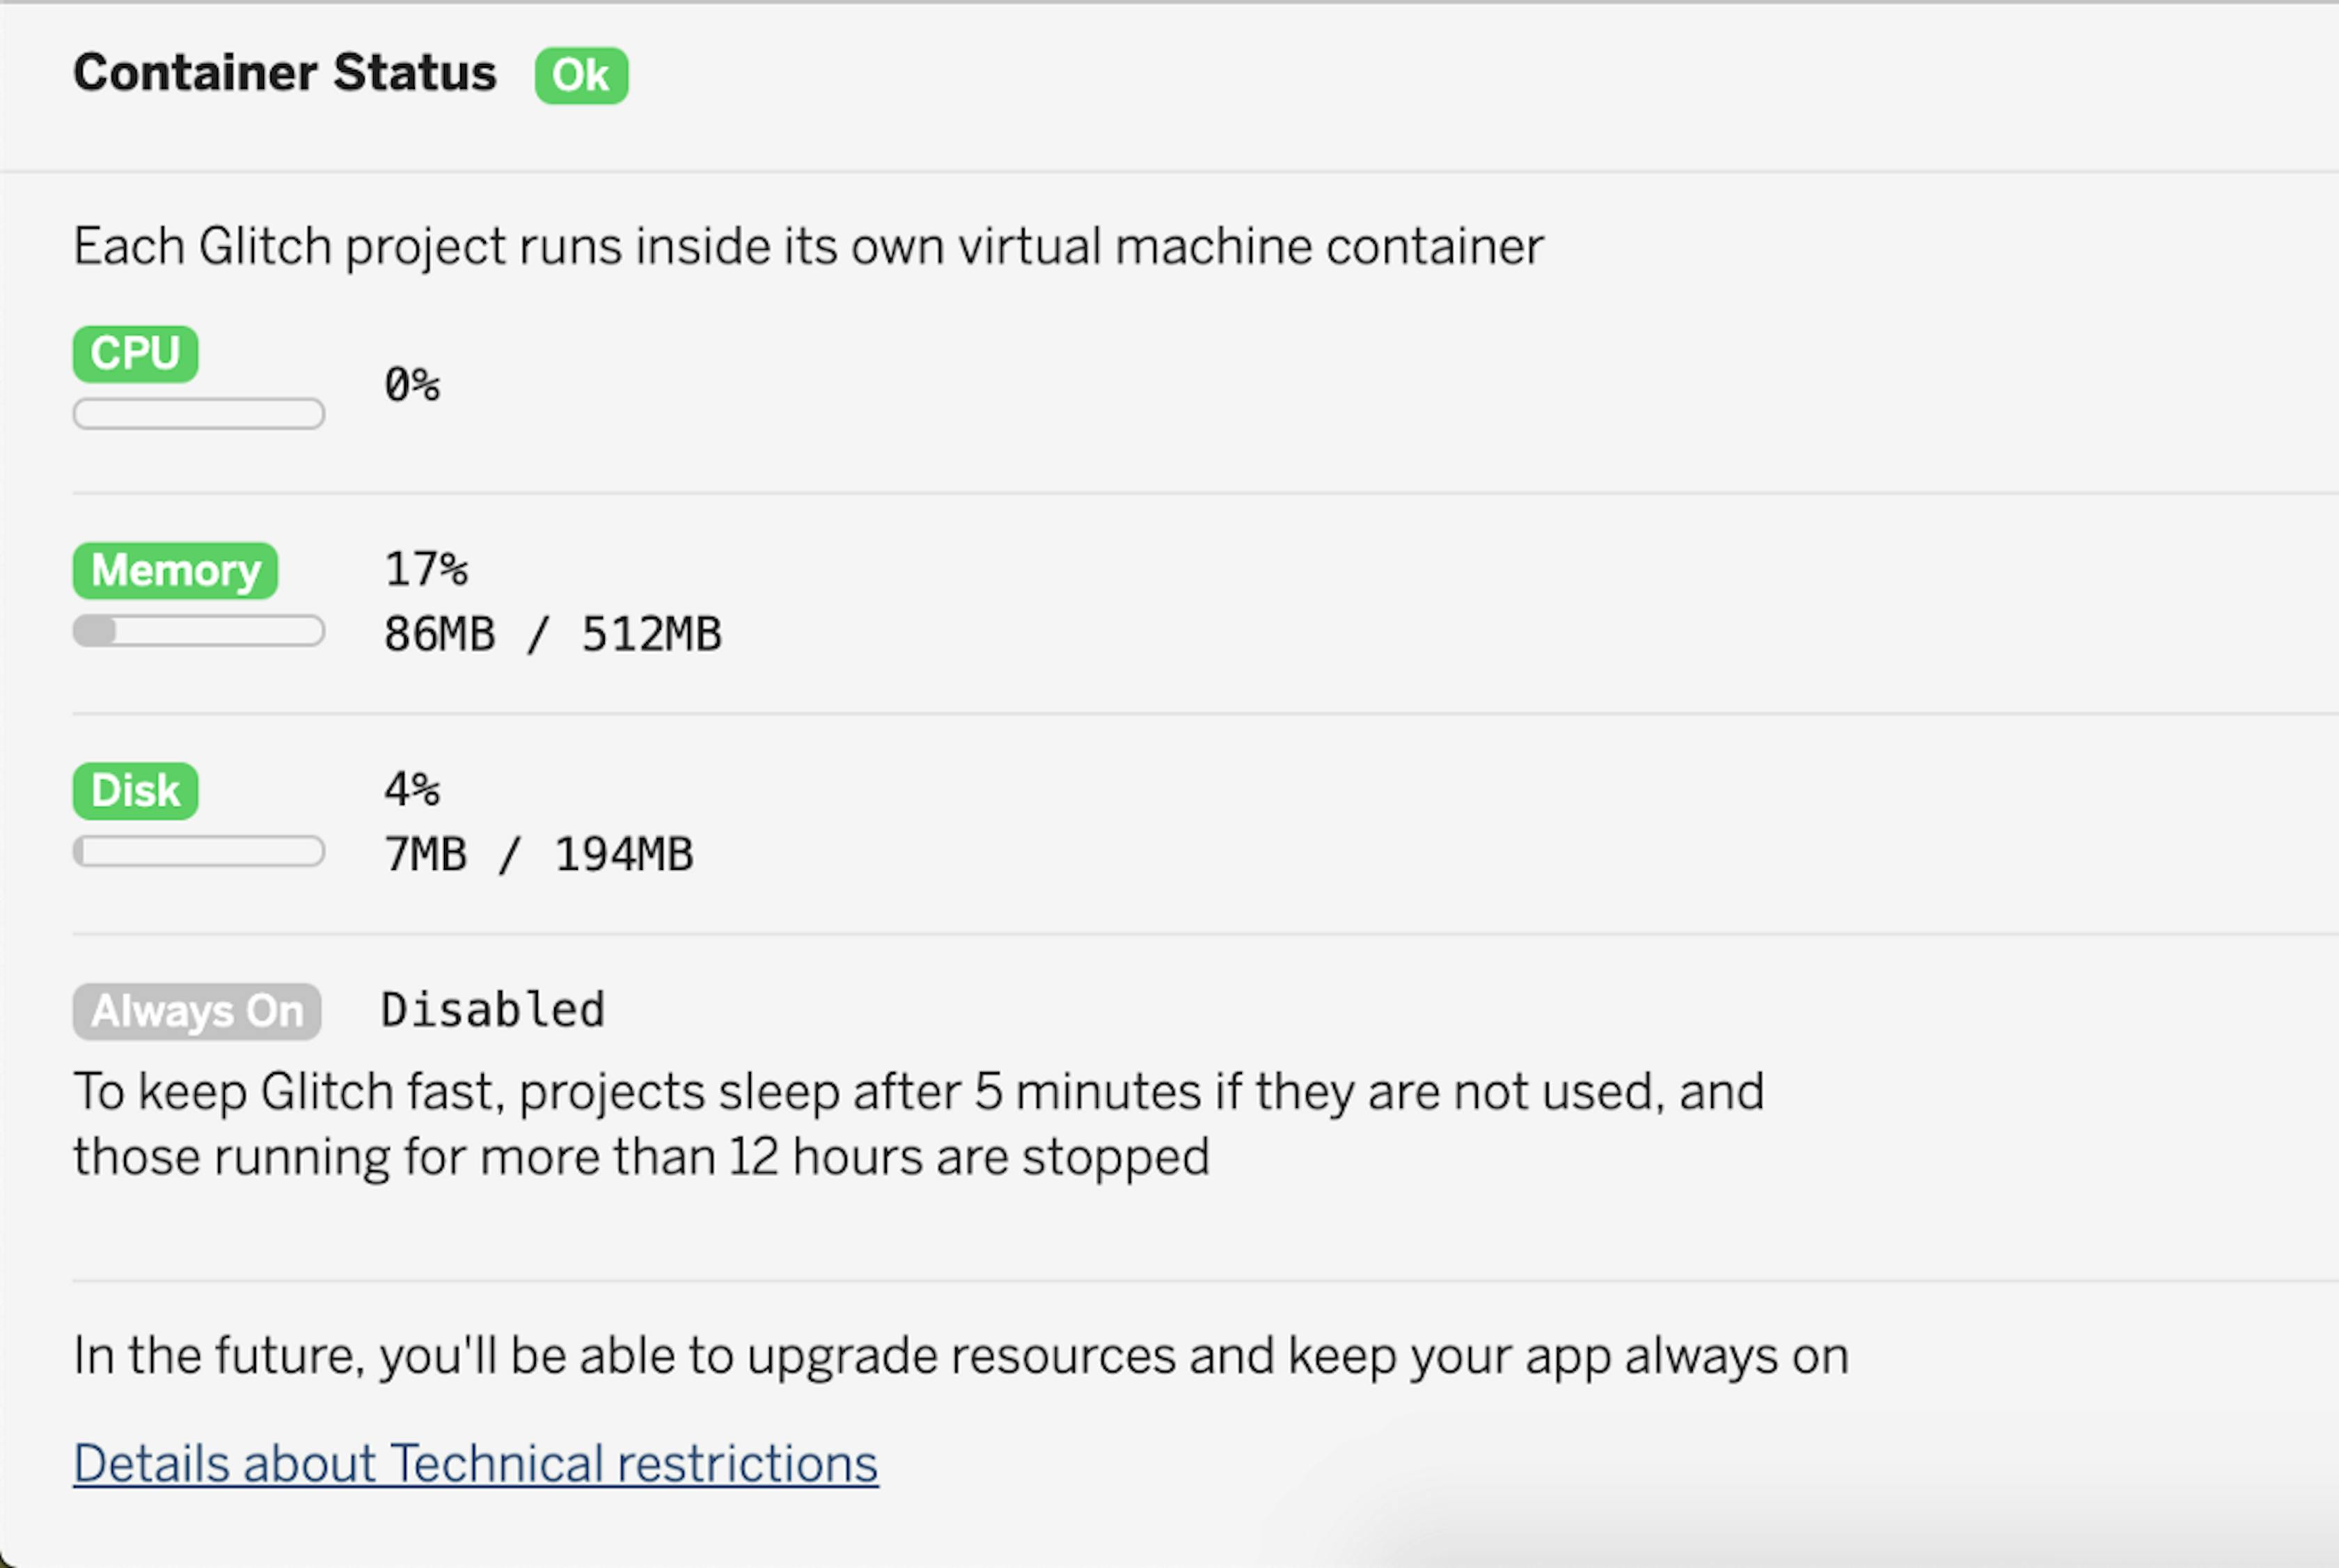
Here, in real-time, metrics are displayed:
- CPU utilization
- Memory usage
- Disk space usage
In principle, everything is very convenient. Well, now let's talk about the features of the console.
Console features
You can go to the console from the Tools menu by clicking on the "Full Page Console ->" item.

Menu item to go to the console
And it is a black page with valuable tips and capabilities of the native console.
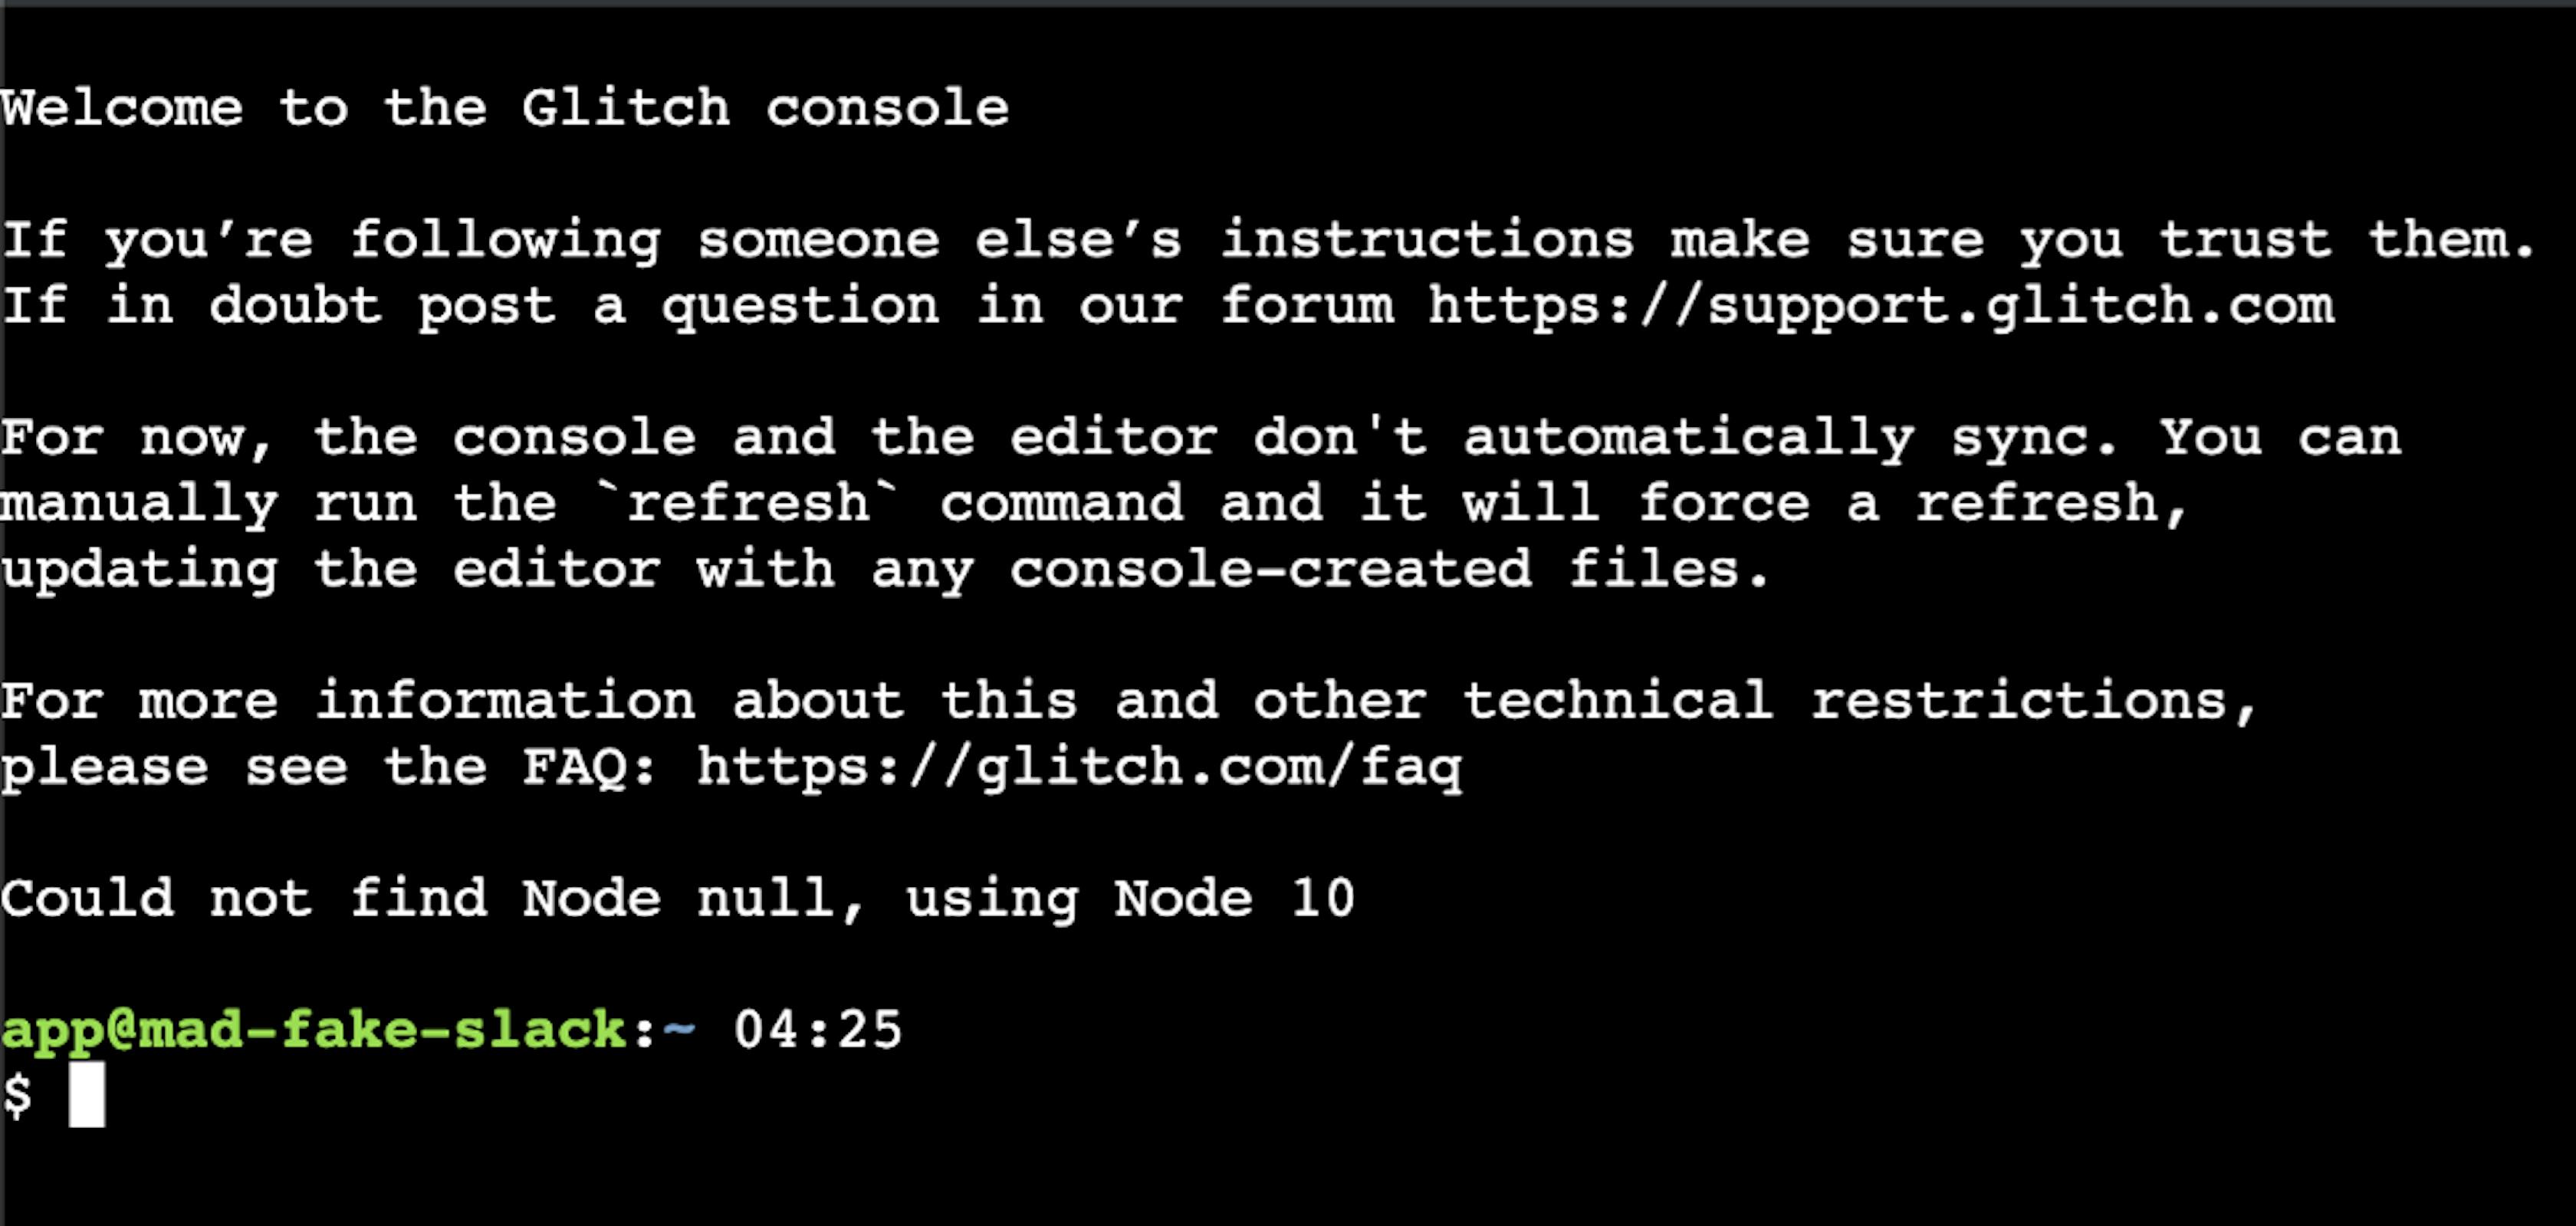
That's how the console meets us
What can this console do?
- Respond to the standard carriage return commands
Ctrl-EandCtrl-Ato move to the end and beginning of the line. Very comfortably! - You can start
htopandtopand close them by pressing theqkey.
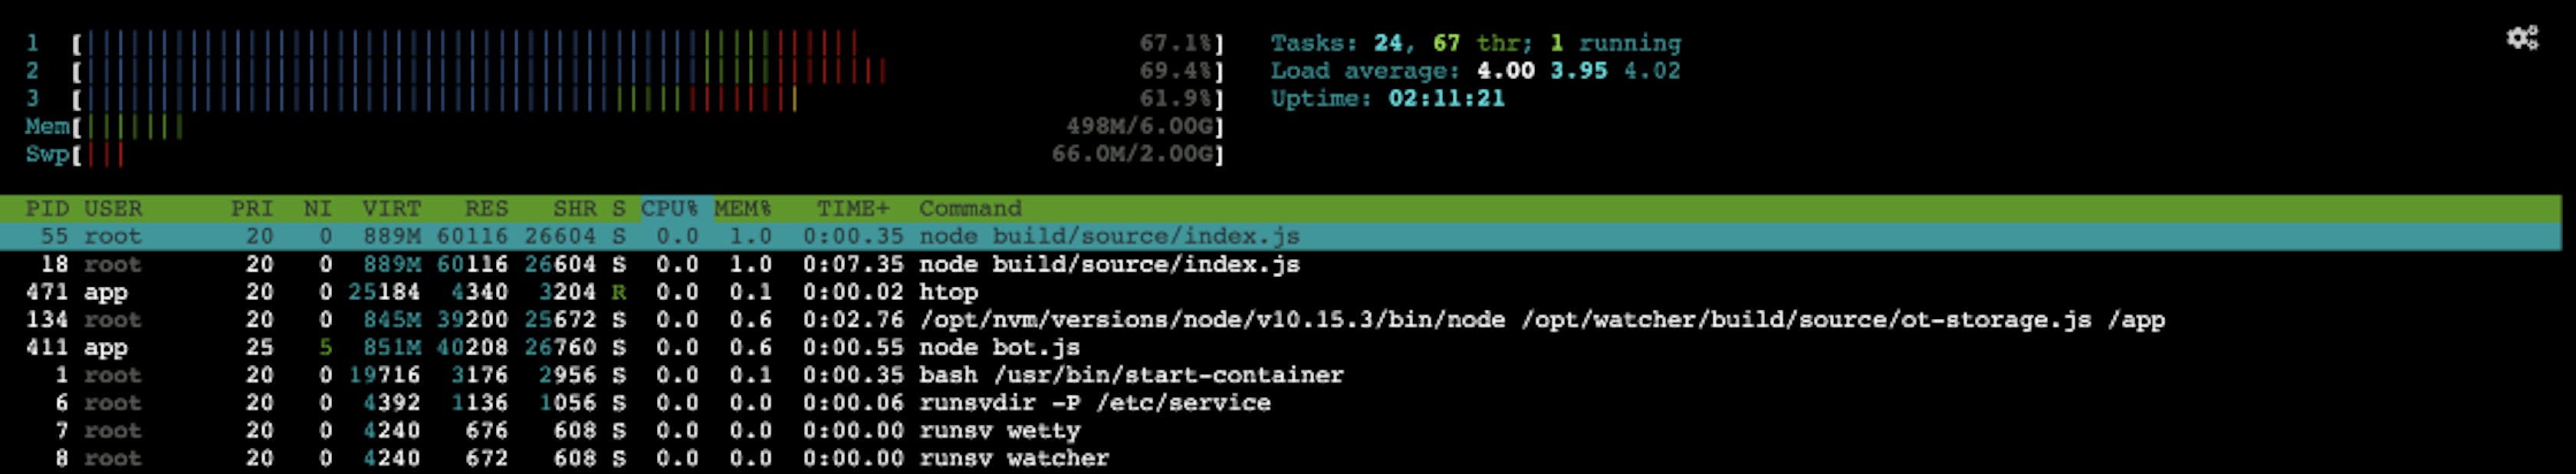
Running `htop` in console
- The
clearcommand clears the console screen. Also, a very comfortable feature. curlandwgetare installed and available on the system.
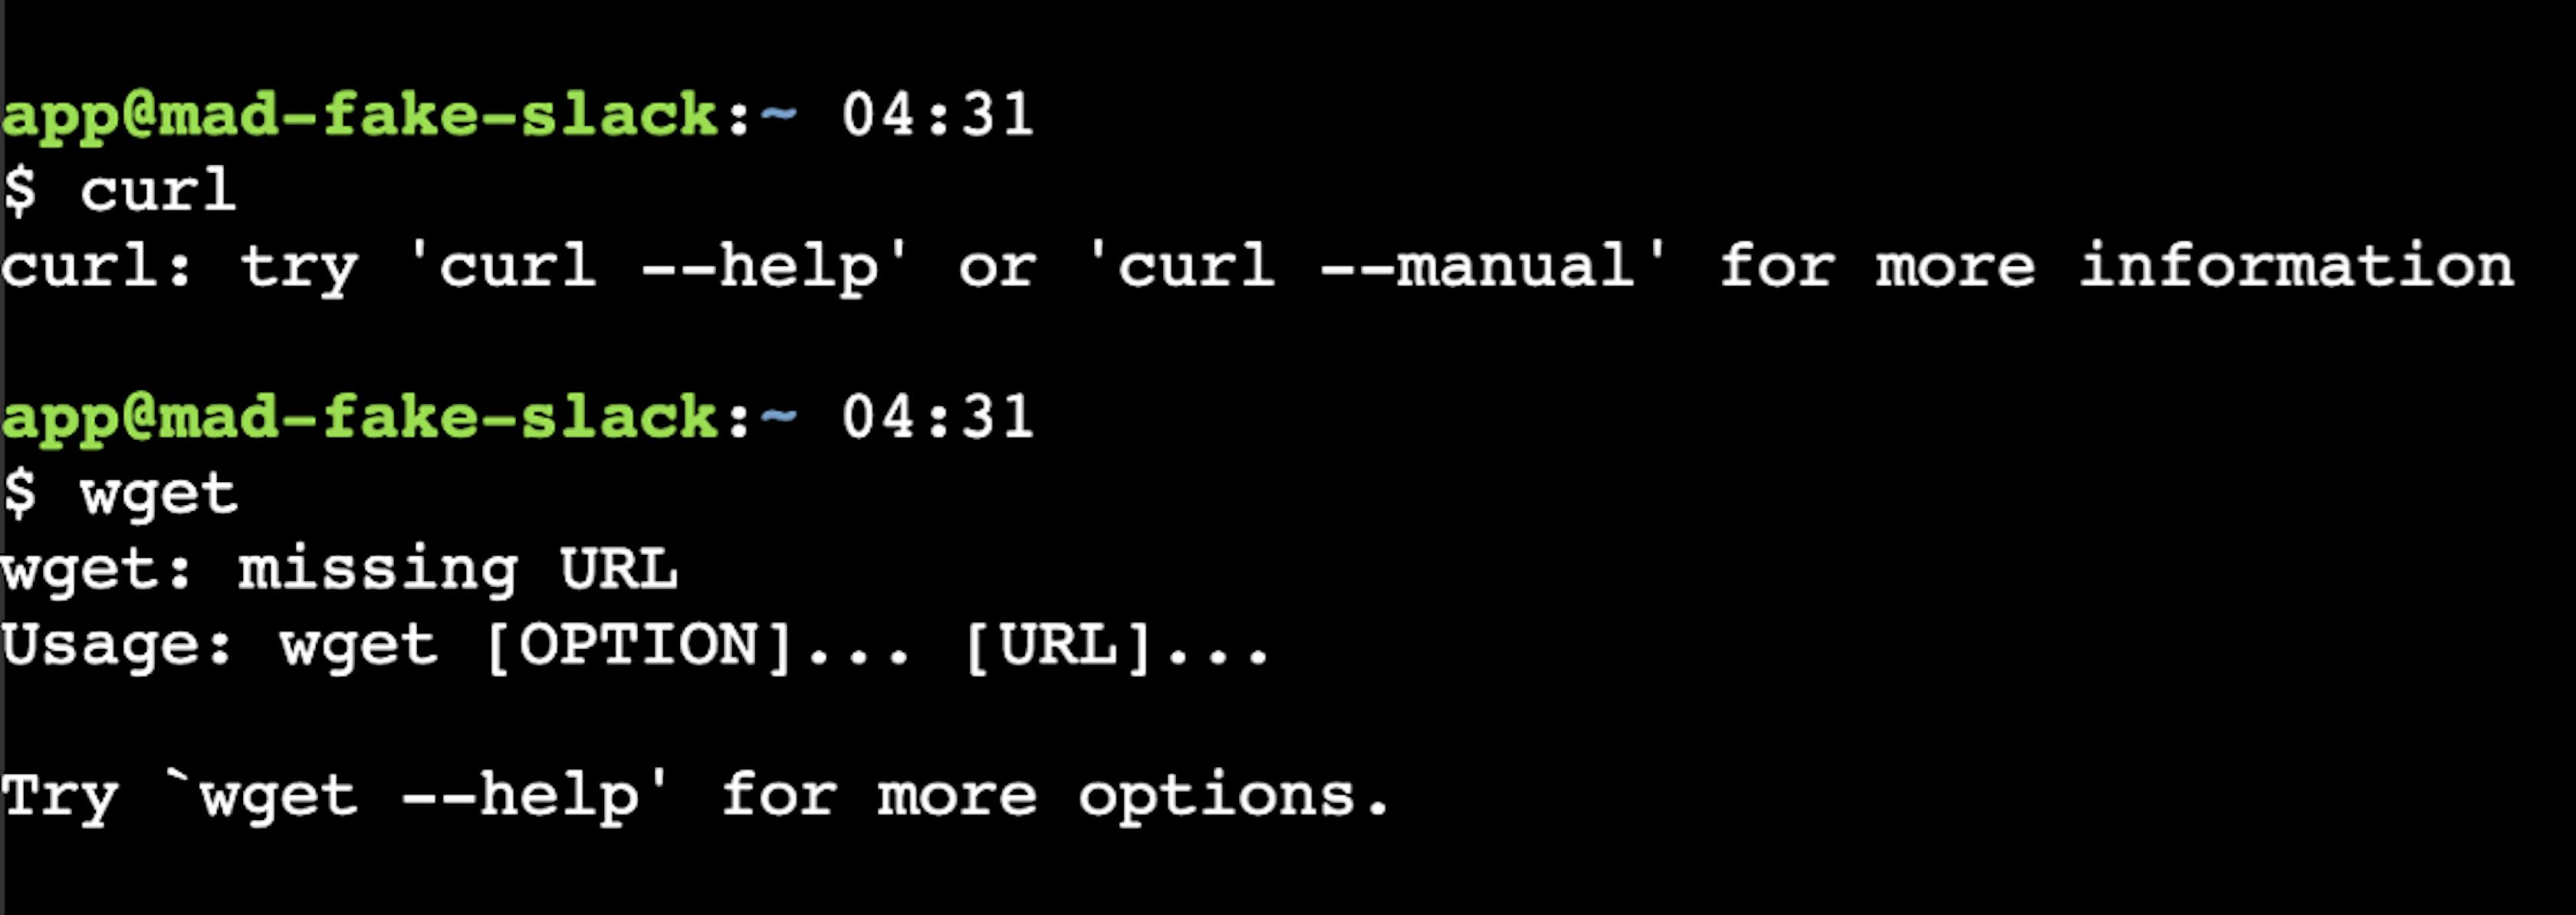
Very useful curl and wget tools
- You can also see the
envthat are installed in the docker

Without problems, you can see what is happening in the environment variables
- In general, we can say that this is a full-fledged console with a set of shortcuts, which I really liked! In this case, all statuses, when using
wgetandcurl, work fine. You can see the progress, and you are in the know of the full picture. - All changes made in the console will not be immediately applied for logical reasons. This approach allows you to think, understand your changes, and when you are ready, just type the
refreshcommand in the console and pressEnter. Your changes will be applied immediately, and the UI will reboot. In the IDE, you will see files or changes made in the console.
Conclusion
The capabilities of the service impress with its simplicity and the ability to perform deployment and make changes with the least number of actions. A full-featured console in a web browser is also a very cool feature, which pleases not only with the high-quality display of data but also with an abundance of default tools, which help you to easily perform the actions necessary to deploy the application inside the docker.

Latest articles here