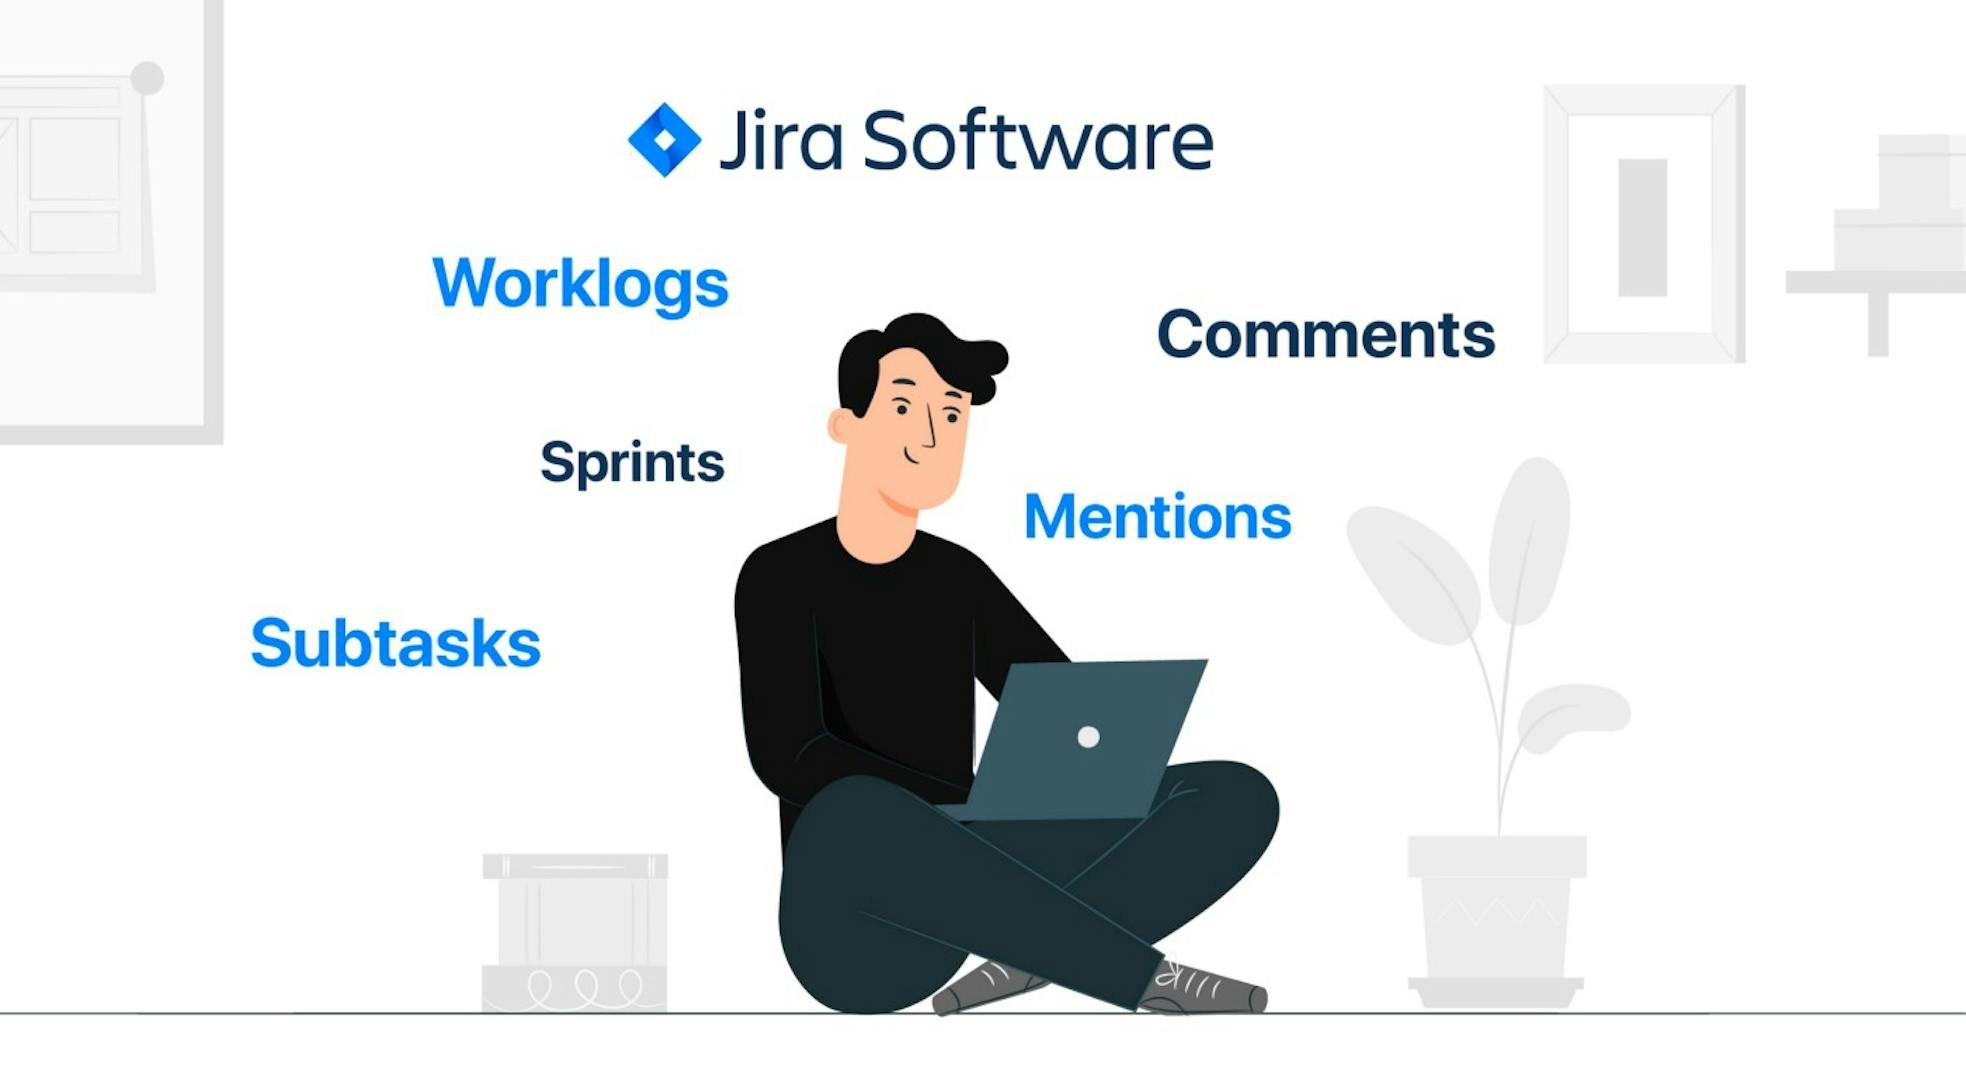
Jira is our primary tool for tracking and managing all projects. We have developed the following rules:
- Break down big tasks into well-defined subtasks
- Write worklogs
- Write comments in Jira
- Update tasks' status and sprint
- Regularity write worklogs, comments, etc
Rule 1: Break down big tasks into smaller, well-defined subtasks
Why do you need to break down tasks into smaller pieces and then combine them into epics? The answer is simple. The smaller the task, the easier it is to finish them. Small tasks increase the chances to find bugs and to uncover issues. The massive task loses the complexity illusion once it is broken down into smaller, understandable pieces.
When we have a complex task in mind instead of finish it — we screw everything up by always overthinking it. We can help ourselves by writing down our thoughts. The main benefits of it:
- We free up space in our brains, and we break the cyclical process of overthinking the task.
- We better understand the problem and look for its solutions rather than just think about it in our head.
It is up to you to decide how small subtasks to make and to tackle. Jira is your personal instrument, and you should use it to fit your needs.
The most efficient way to break down tasks is to do it with the project manager and the stakeholder. It allows us to gather all the necessary information to estimate the scope of work accurately.

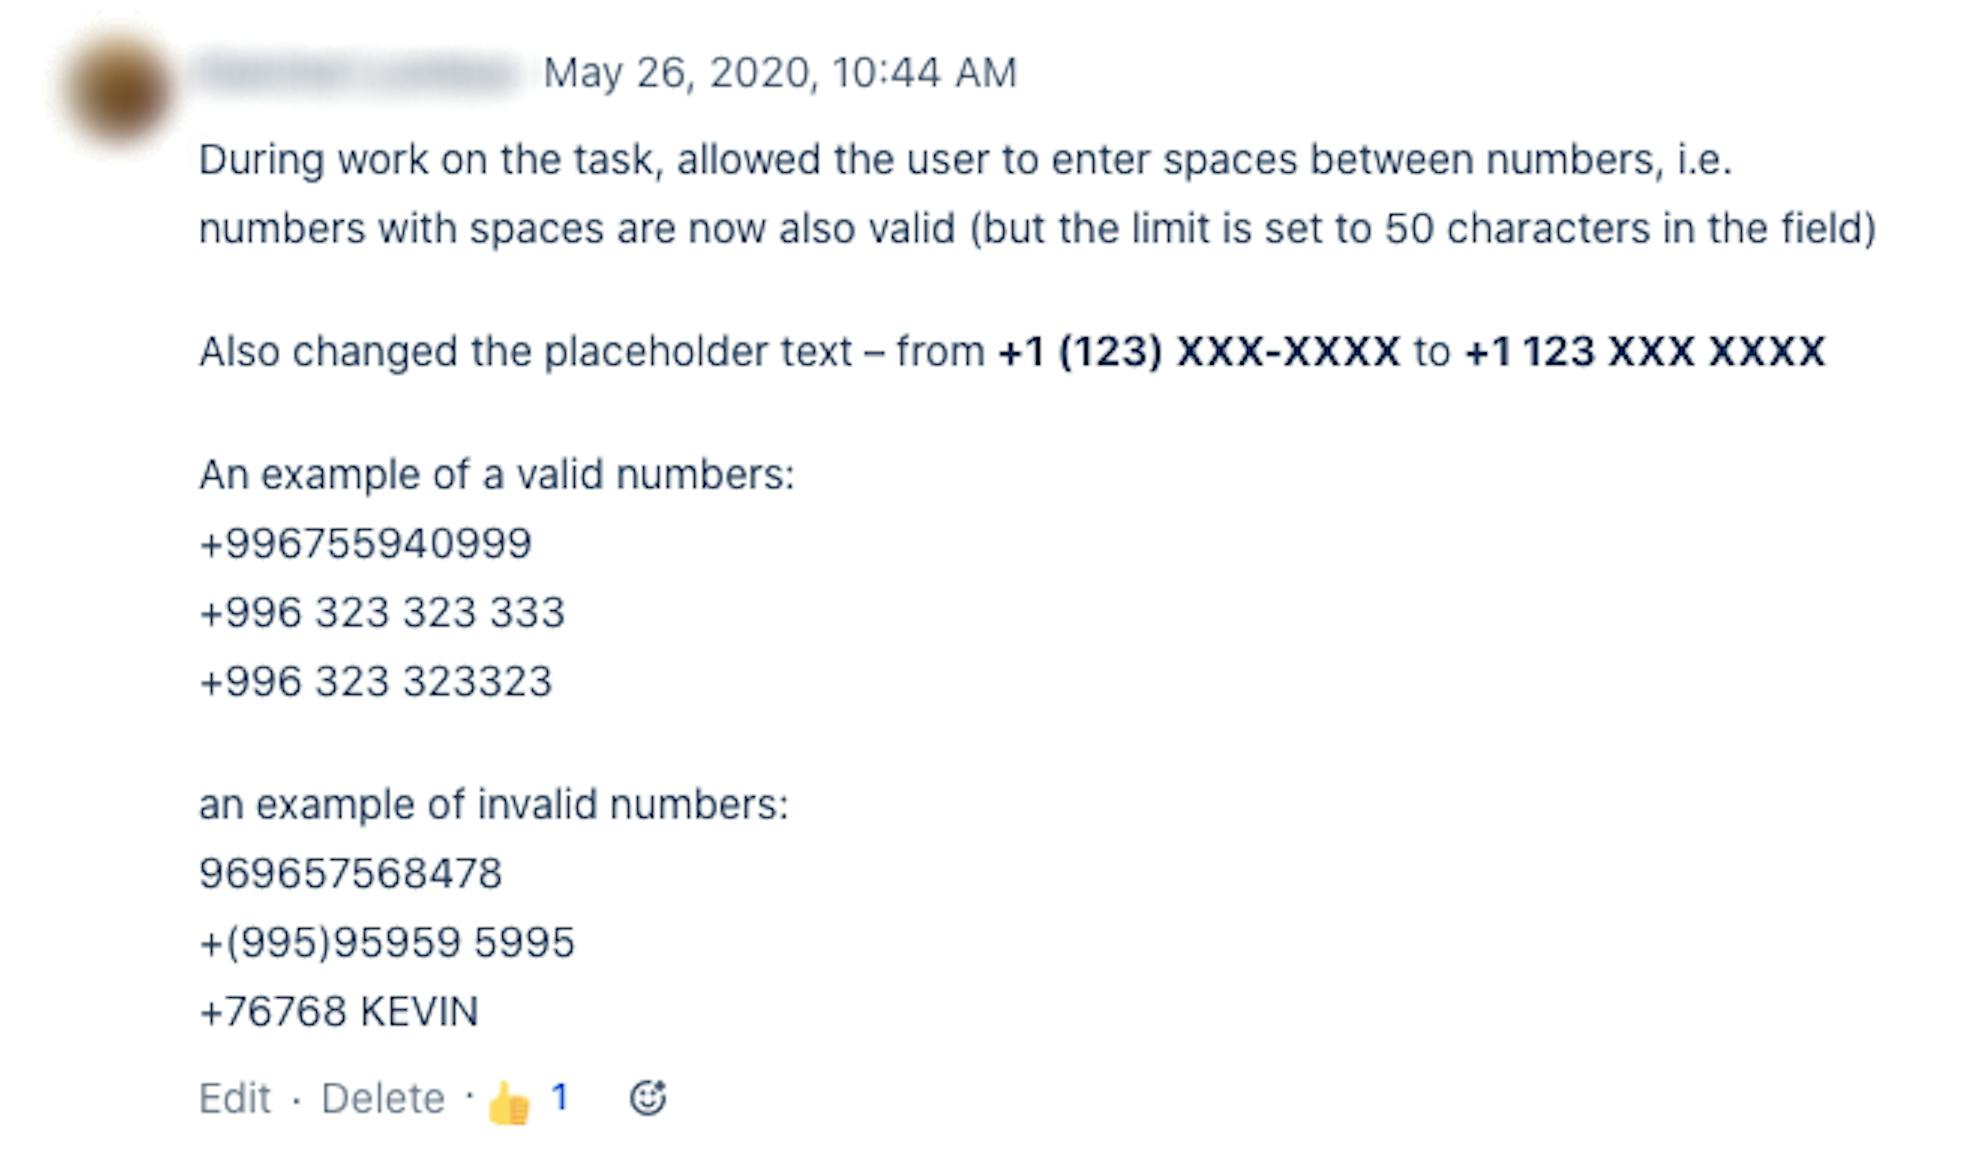
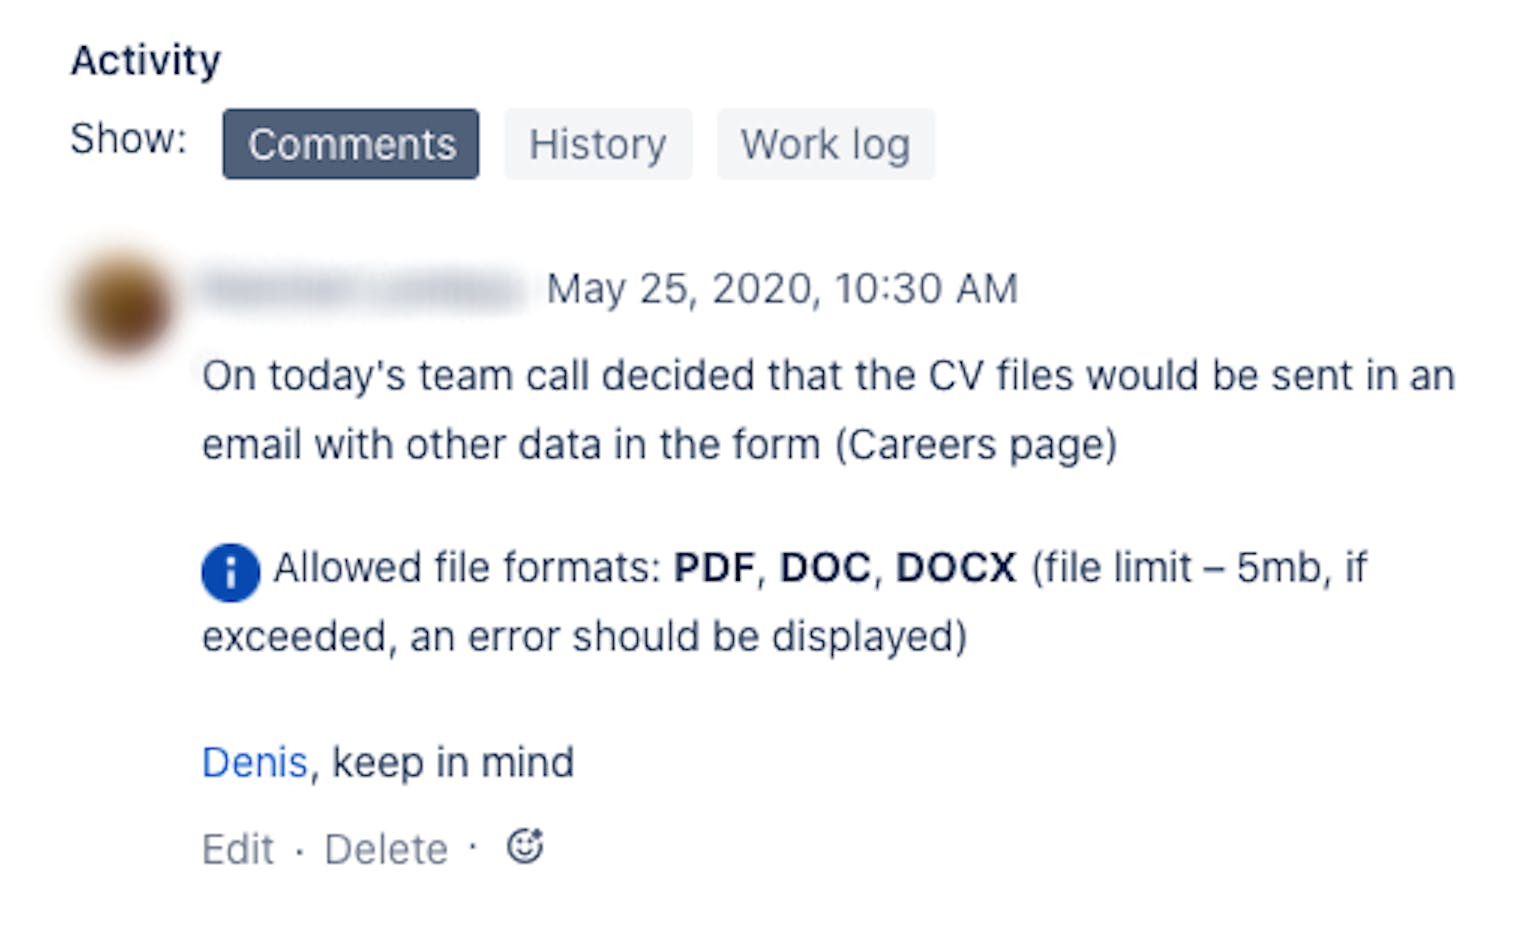
Rule 2: Always write comments
Writing comments might seem like a waste of time when you already write worklogs. Yet comments are the critical tool for the transparent team’s communication. Writing comments pursue four goals:
- You can always get any feature's documentation from the comments. At the very least, you will have already written enough text that can be put in the docs.
- We free up space in our minds by writing down the things that we’ve already tried. We also write what we are going to do in the future so that we don’t get lost without knowing it.
- We communicate on a task in one single place. If we had a conference call, let’s write down the summary (same for the communications via messaging apps). If you ask something in a chat, write down the answer inside the ticket. If you try various solutions and it is still unresolved, write down all of them. Comments are your investment in your brain’s sanity. What is not written down — never happened. Proper logging of everything outside of Jira provides you with security in the future. If you happen to have any dispute, you will always have proof of your decision inside a ticket.
- Comments are a useful developer tool for dealing with past issues. Imagine that you were doing a task, writing down detailed comments. You finished the task, deployed it, and half a year later, the feature is broken. You don’t currently remember the context of how to solve this particular issue, but you find a ticket that contains all the necessary steps to solve it. Using these comments, you help your future self to solve these issues quicker. Of course, this does not happen with all the tickets, but you never know which past issue might create a problem. That’s why you must always comment on every issue.
Once again, the comment section is your personal tool. Though you still need to keep in mind that your comments should also be understandable to your teammates. They help you see the whole work process so that you can decide what to try and what not to.
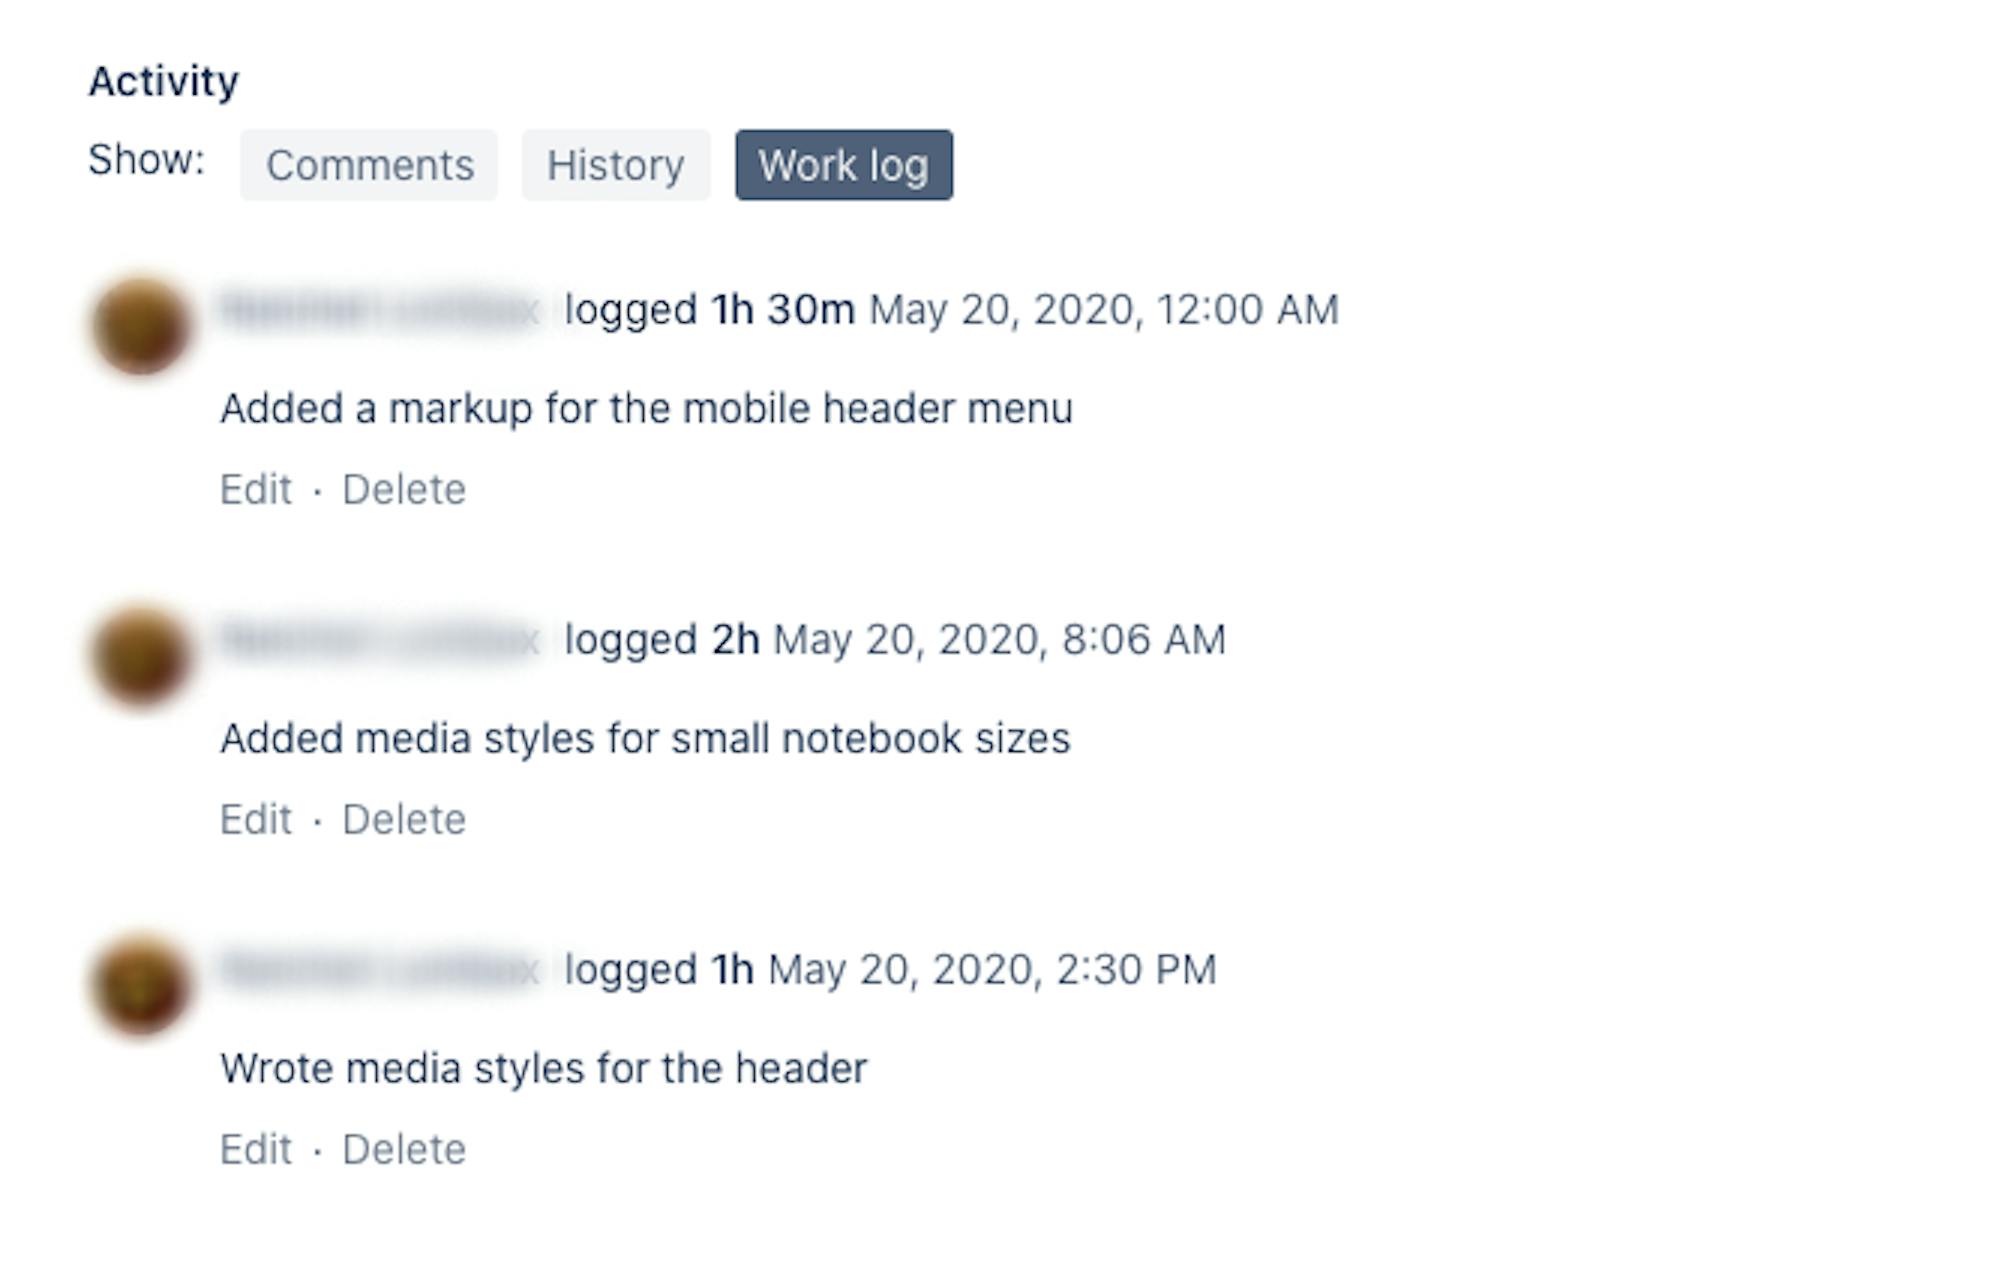
Rule 3: Prove your work with worklogs
If comments reflect our task solving process, Worklogs reflect the RESULT we've achieved in a given time. If you've been researching, then you should describe the result of your research and attach some materials if needed. We always write down our work progress in a work log, even if the ticket is not yet closed.
Remember, the work log and the commits are proof of your work in a project. It is your insurance in case of misunderstandings or questions from the client regarding the time you've spent. The absence of worklogs means that there is no evidence of what has been done and achieved.
If you forget to log work, you can create it with a backdate. But if your manager sees it, you owe him/her a cookie/beer/bbq/chocolate or whatever they choose.
Need more experience in Jira? Discover how we've integrated Jira Automation to Project Managers', HR's, QCD's repeated processes:

Rule 4: Complete tasks before the end of the sprint
Sprint planning is a vast topic that requires its own article, but let's briefly cover the process here. Regarding the tasks in Jira, all of the tasks must be closed before the end of the sprint. It is possible to ask the manager to move the task to another sprint, but this must be done as soon as possible.
Additionally, all the tasks created during the given sprint must be included in that sprint (often tasks are being created after the start of the sprint and often get omitted from the final work report).

Rule 5: Regularity write worklogs, comments, etc
Optimal frequency: once every 1 to 3 hours. Comments should be added according to the "the more, the better" principle. You need this to understand in time that you’ve dug up a hole for yourself but haven’t realized yet. Just remember. What’s not written is wasted.