
Today, the main focus of software development management is to achieve KPIs and, ultimately, to achieve desired results and improve team performance. Key performance indicators are often used in technical work settings to stay accountable with the goals you have set. The path can be complex and exhaustive, so KPIs are very useful for software development teams.
The traditional approach to software development is mainly focused on quantitative metrics such as the number of lines, bugs, and meeting deadlines. But modern agile methodology aims to analyze and optimize the qualitative factors through a combination of qualitative and operational metrics.
In this article, find out the main types of key performance for software developers and how to measure them.
What is KPI for software development?
Some teams still rely on their gut instinct to set a productive and efficient workflow. Unfortunately, this mentality can lead to many unexpected failures, especially when it comes to measuring and planning for success.
To prevent this mistake, the team should have clear-cut goals and a strategy to achieve them. The key performance indicators help the team measure productivity and plan for efficiency.
Key performance indicators (KPIs) are values that measure the overall performance of a company. They are also used in software development to support business objectives.
Most of the time, key performance indicators are used to measure the number of lines of code, commits, and deployments. But, this approach is not very accurate and does not provide real objectives. One of the most influential factors in setting software development KPIs is the quality of their targets.
Why metrics are important
Creating software development KPIs that are aligned with the goals and the commitment of the team members to reach them is necessary to ensure high-quality software.
When a problem occurs, having a set of metrics helps identify the issue and highlight the most important ones.
KPIs also encourage productivity. Recognizing the team's collective efforts helps the developers identify areas of concern and fix them. Having a set of software development KPIs can help you measure your team's progress and improve your ROI.
To determine if KPIs are correct, you need to consider some nuances. Each of the key indicators should be SMART. It means that they should:
- be calculated for a Specific purpose
- have a Measurable entity; evaluate the actual activities of the company
- be Achievable
- be Relevant to the performance;reflect efficiency
- Time-bound; describe a specific time period.
You can also get our free consultation if you need more expertise in improving productivity and collaboration within your software development team. We are always ready to provide our best project management practices.

Types of key performance indicators
In this article, we look through 3 types of KPIs — financial, customer, and software.
Financial metrics:
In terms of finances, companies measure their profitability. They do so by tracking income and expenses, such as taxes, interest payments, and depreciation. This helps determine how much money must be allocated to meet their annual budget. Also, by comparing these figures with competitors, business owners can get an idea of what has been done well and what needs to be improved in the future.
Common applicable metrics:
1. Working capital is the amount of cash a company has to spend on its operations. It's also used to compare current assets and liabilities. Positive working capital is very important to ensure that the company can meet its short-term obligations.
2. Net profit margin - is a critical metric for measuring profitability. It shows how well they can generate profit from their revenue.
3. Operating cash flow is an indicator of how efficiently a company is able to spend money on operations. It can be used to compare the amount of money a company generates through its daily operations. The metric strips away the various non-operating activities of a company, such as investments, to reveal the overall state of the company's operations.
4. Monthly recurring revenue (MRR) measures how much revenue a company expects to generate monthly.
5. Annual recurring revenue (ARR) is similar to monthly recurring revenue, except that it's calculated on an annual basis.
It's also important to understand how the ARR and MRR change over time, as changes in the business's operations can affect the company's value.
6. Average Sale price (ASP) is the average sale price of a product or service and it can be calculated by taking the sum of all of the company's new sales during a period and dividing it by the number of customers.
7. Account receivable and accounts payable measure how much a company collects from its customers for the services or goods it provides. It can be created by a single purchase made by a customer without paying.
Accounts receivable can have a significant impact on a company's financials. Although it's technically a company asset, it can also be risky to not collect the full amount due to late payments or inability to receive the payment on time.
Customer metrics
They help companies measure how satisfied their customers are with the software. One of the most important factors businesses can consider when assessing their customers is their retention and efficiency. This can be done by taking into account the various factors that affect their customers' behavior. For instance, the Customer Lifetime Value (CLV) measures the value your organization gets from its long-term relationship with customers. It can help you identify which channel is most beneficial to your business.
A good performance indicator is the number of customers your company has gained or lost. This metric can help you determine if or not you're meeting your customers' needs.
Another factor that can be considered when assessing customers is acquisition cost (CAC). The acquisition cost is divided by the number of new customers you're looking to acquire in the next couple of months. This is a great way to measure the effectiveness of your marketing efforts. If you compare the CLV and the CAC, you can get an idea of how efficiently the company is able to reach its goals.
Also, there is Net Promoter Score. The Net Promoter Score is a measure of customer satisfaction and loyalty used to predict the likelihood that a customer will recommend a company's products or services to others. The NPS is calculated by asking customers a simple question: “How likely are you to recommend a product or service to a friend or colleague?” A score of 10 indicates that a company is highly likely to improve its customer loyalty.
How to build transparent work processes, so stakeholders have no questions about where the money was spent? Read Oleg Puzanov's new article, where he reasoned about the future of outstaffing and outsourcing and described the new approach to cooperation models - Transparent Remote Staffing.
Software metrics:
Overall we can divide software metrics into 5 categories:
The formal code metrics are used to evaluate the quality of the code. They include lines of code, instruction path length, complexity, and overall development process.
The productivity metrics of software developers help analyze the time and effort that goes into developing a project.
The test metrics that are used on a product impact its overall quality. Comprehensive testing helps determine how effective the tests are. What information can be checked there:
- Whether all tests have passed or not;
- The total coverage of tests in percentage;
- How many statements in the program have been executed;
- How many branches of the control structures have been executed;
- How many branches in the control structure have been executed;
- How many lines of source code have been tested;
- How many functions defined have been called.
The operational metrics of software are used to analyze their systems' stability and maintenance efficacy.
With the rise of automated data collection, it's possible to gather vast amounts of information. However, this method can lead to over-reliance on the data and result in a poor report. In order to minimize this issue, team members should use the metrics in their chosen manner.
Modern software development teams prefer to use agile methods, Mad Devs included. With agile, the workflow can be easily adjusted to deliver a product that fits the schedule. So there are specific KPIs to regularly monitor and analyze the performance of the various stages of the development process.
Let’s discuss them.

Measuring work in progress
Team velocity
Projects are typically divided into sprints, which are usually focused on specific tasks. Each sprint has a number of these that must be completed by the end of the working day. During a sprint, you can use velocity metrics.
There are many ways to measure velocity, such as story points. One of these is to measure the amount of work that goes into a software product.
Knowing the story points of a project helps you estimate the time it will take to build and deliver it. Doing so allows you to get a good idea of the team’s goals.
Important tips for measuring velocity:
If velocity stays consistent after multiple sprints, consider incorporating other factors into the calculation.
When multiple tasks are added or removed from the calculation, the velocity can be calculated differently.
If you want forecasting based on velocity, the average of three sprints is enough for predicting future performance.

Sprint Burndown
Most software companies use Scrum to organize product development that divides it into fixed time intervals, called Sprints. At Mad Devs, we use it as well. Here is the article to learn more about it.
So, the sprint burndown chart visually represents the team's workflow. It shows the total amount of work that has been completed and how much more is still left to be done. Ideally, it should be averaged to show the lowest possible number of tasks or work hours.
Using sprint burndown as a metric helps teams keep track of their performance when it doesn't match their expectations.

Release Burndown
A release burndown chart is similar to a sprint burndown chart in that it shows the project's status as it relates to its release date. It can be used to inform customers and employees about delays or early versions of the project. In other words, it can help users determine if the project can meet the deadline or if it should move further beyond that.
A good release burndown chart also helps users determine the number of sprints that are required to complete the work.

Example of release burndown chart

Process health and bottlenecks
Cycle time
A cycle time chart shows when a task will most likely be completed. It shows the time when that task is most likely to be finished.
Knowing how fast your team works can help you improve your team's performance. It can also help you determine the right amount of work to do next time.
You can also stack all the cycles for a specific period and compare them to other data to better understand the work's quality.

Example of cycle time chart.
Cumulative Flow
Cumulative flow (CF) is a visual diagram showing the status of all the tasks in progress. It uses a color scheme that shows the various stages of the project. The goal of this chart is to provide a visual representation of how tasks are distributed across the various stages.
The diagram shows the relationship between the time and the number of tasks on the project. It highlights the various stages of the work process and shows the percentage of tasks that have been completed and are in review.
A cumulative flow chart can help you keep track of the team's work output and keep them accountable for consistent performance.
The CF is a great tool for teams that are focused on keeping track of all of the tasks that are in progress, to do, and finished.
The chart can also identify when the work-in-progress limits are exceeded. This feature helps develop a culture of finishing work and minimizes multitasking.
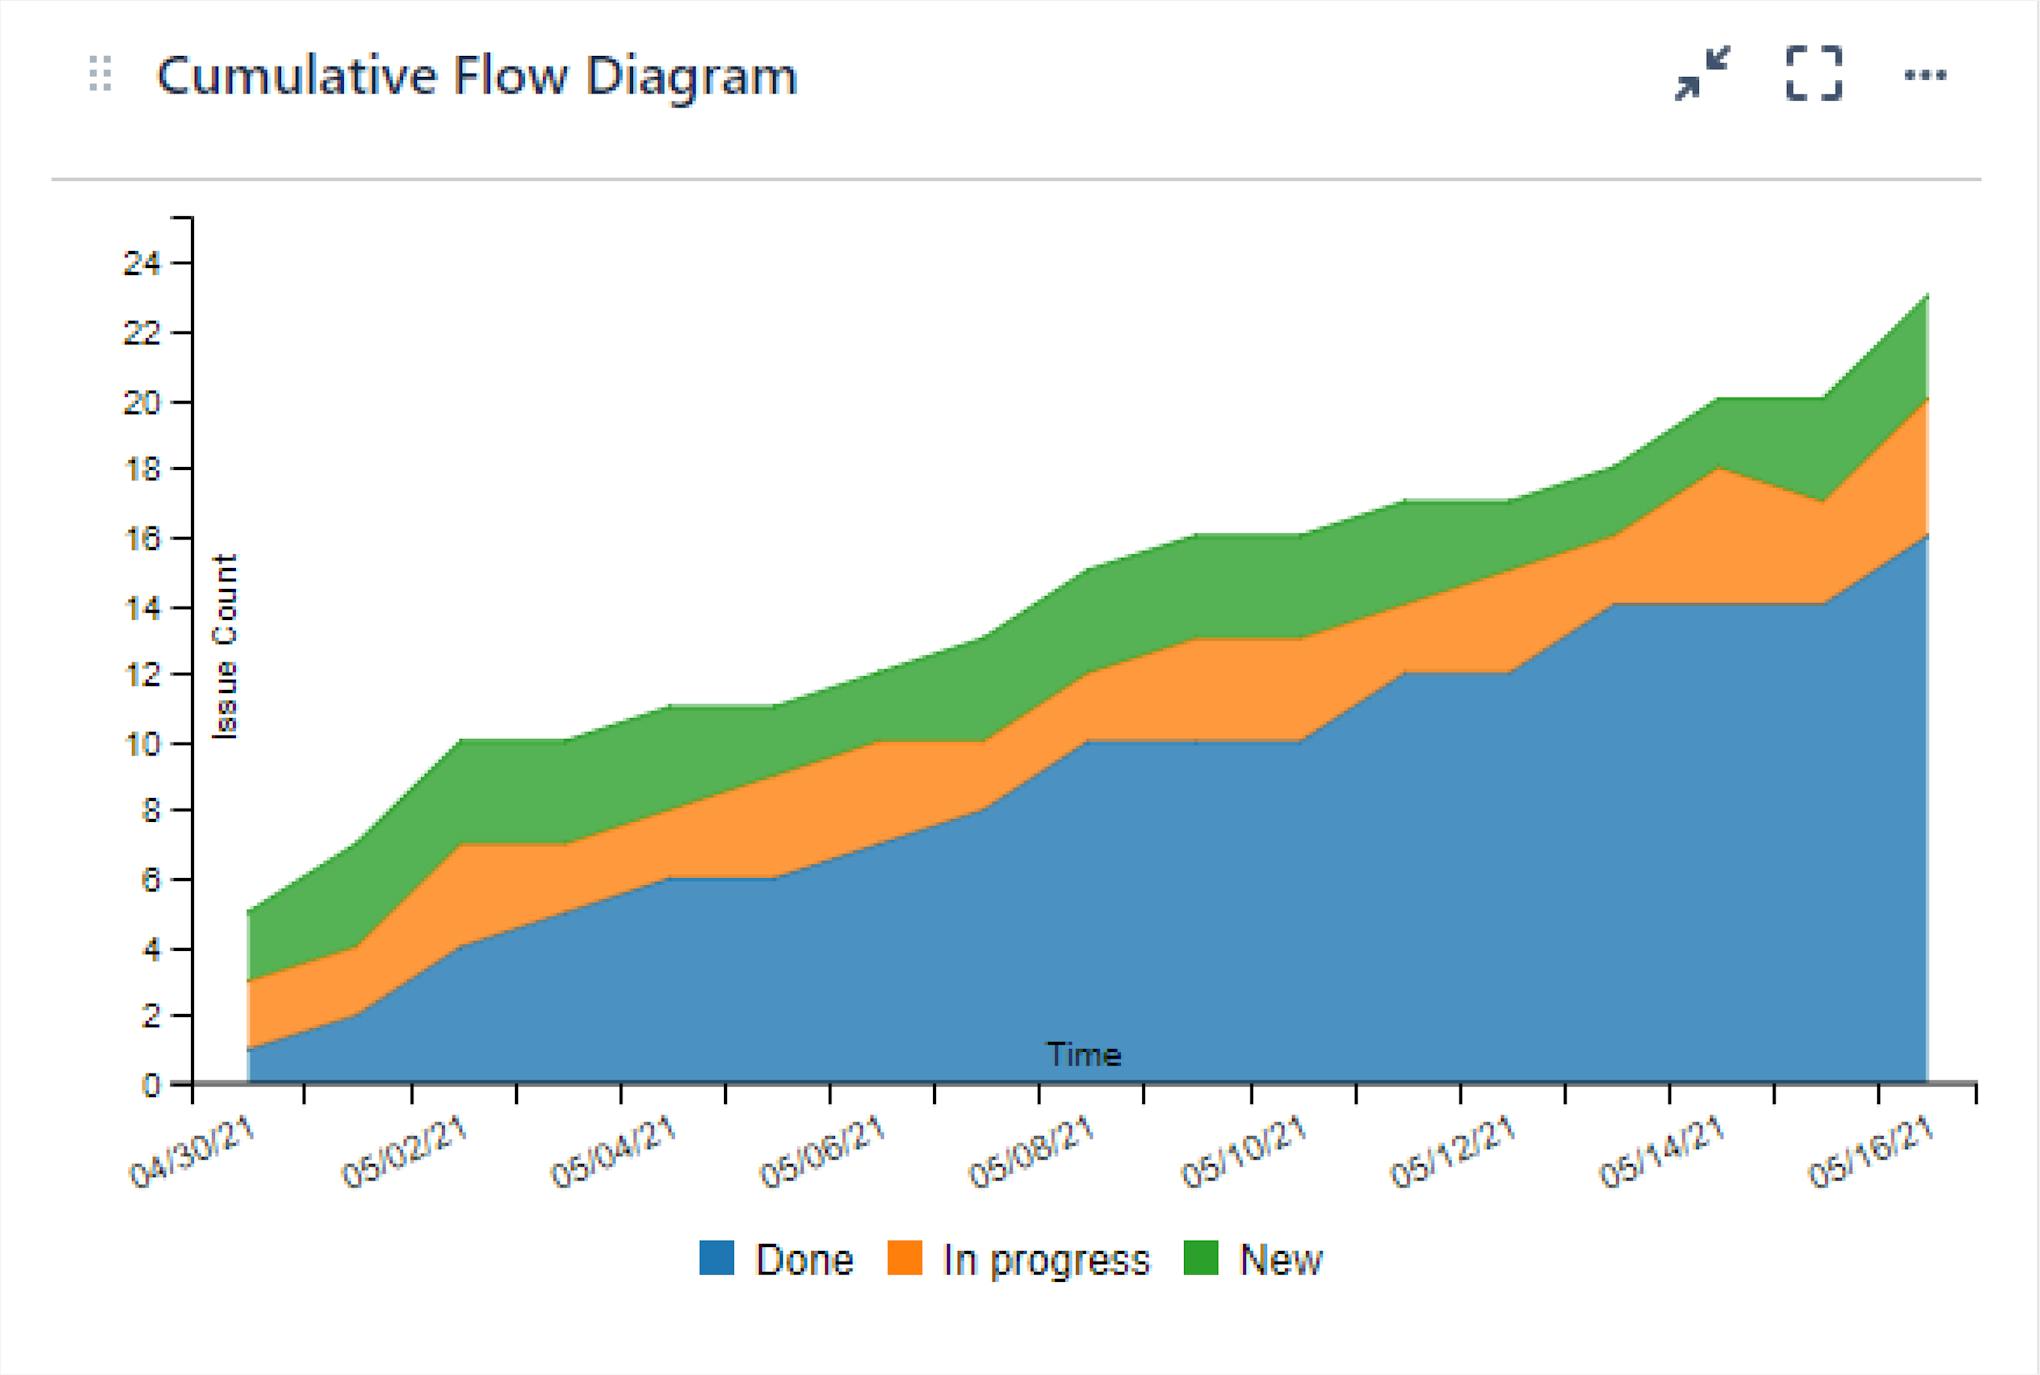
Example of CF diagram.
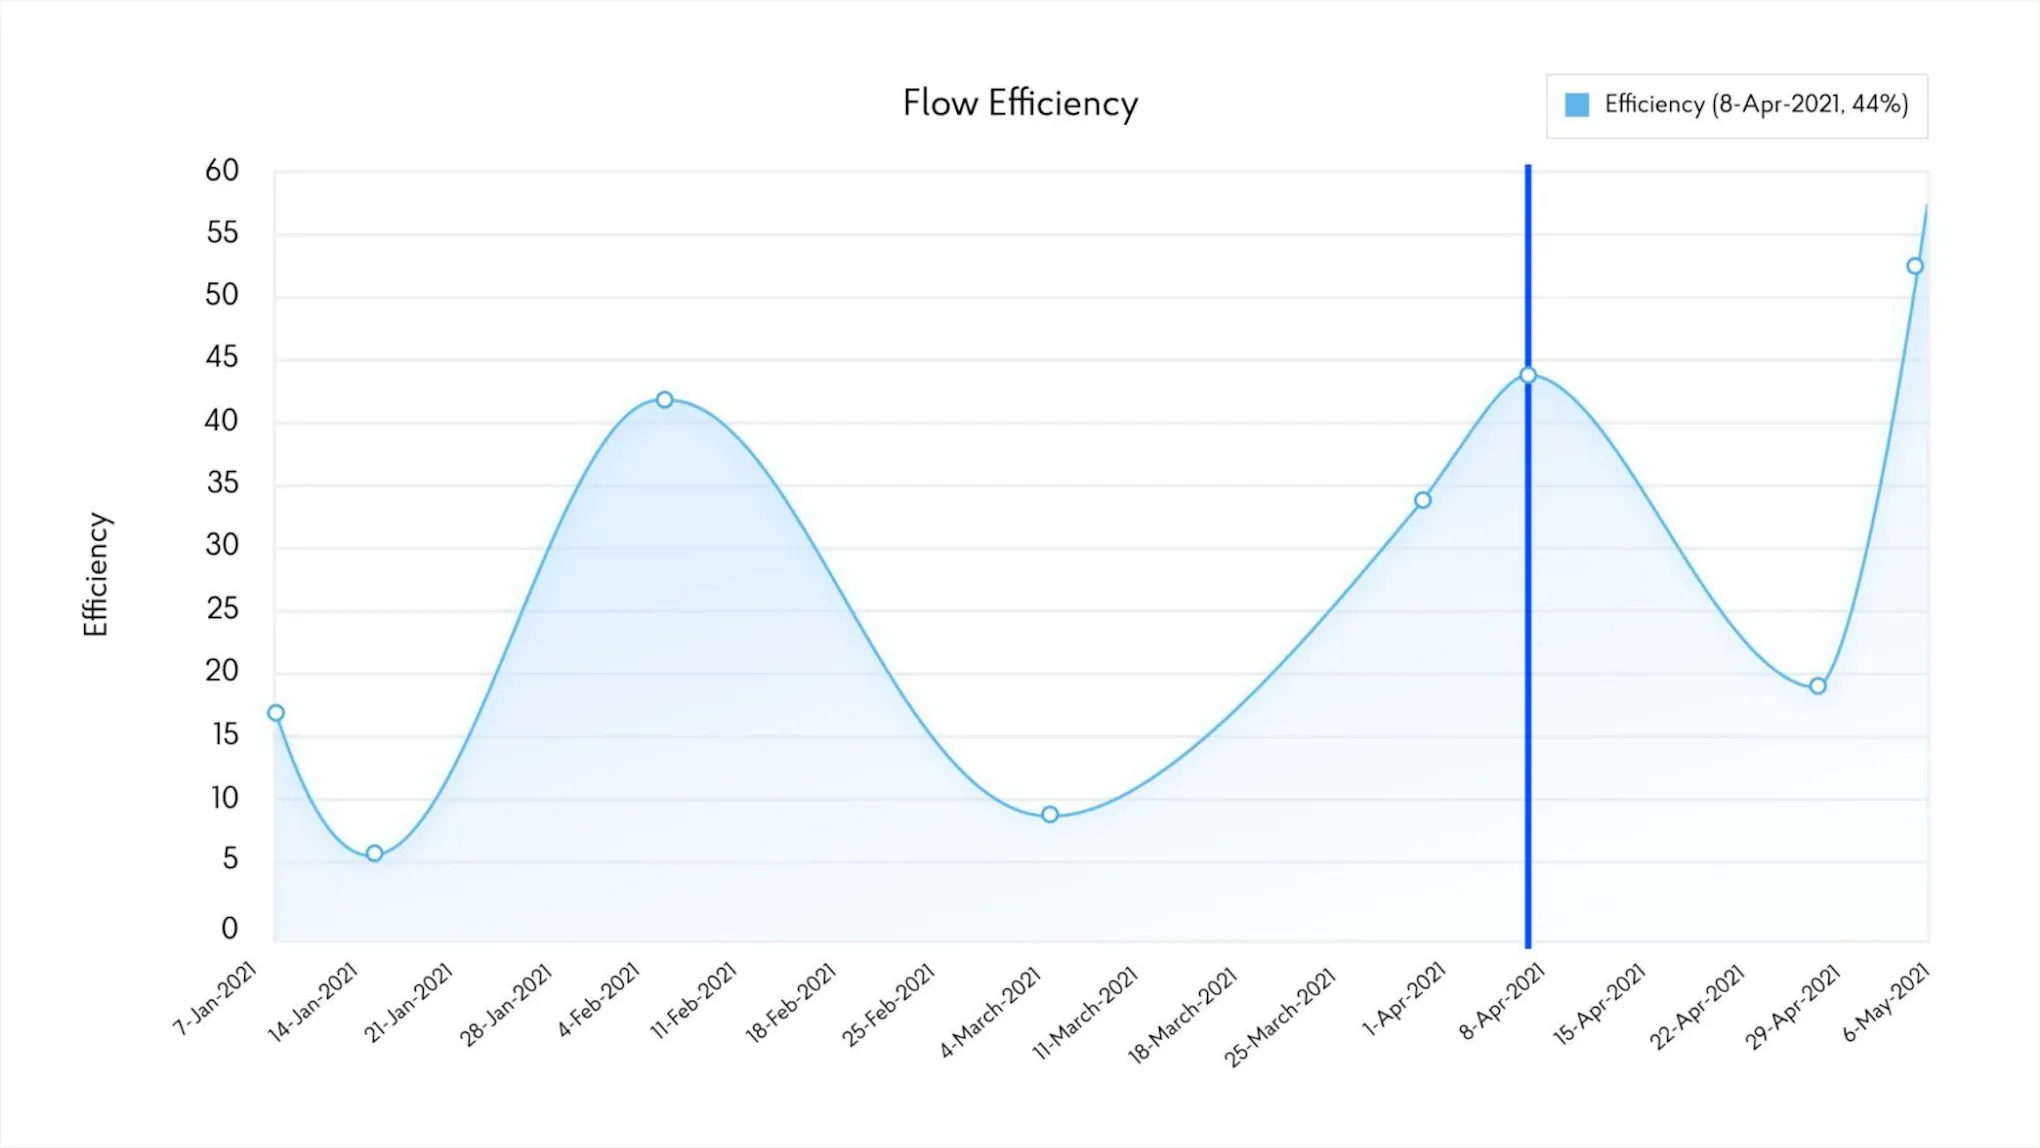
Flow Efficiency
Flow efficiency is a metric that shows how much time is left to be done. It presents the difference between the time left and the amount of work in progress.
Divide the time you spend working by the total cycle time to achieve flow efficiency. It can help identify areas of weakness or make changes to how the project is managed.
It can also give insight into the distribution of work between the various waiting periods.
Sometimes, the code has many dependencies, and you can't start working on something until another one is finished. This can be useful for tracking how much time you're waiting for work to get done.
Code quality
Code coverage
A good code coverage metric measures how many lines of code are executed while a test is running. It's typically used to evaluate the continuous delivery process and test-driven development practices.
Don't overestimate the number of lines that have been covered. Also, calling a line of code multiple times isn't always enough to close a test. Instead, it should be used to highlight the code that has been covered and may be of interest to testers.
Although achieving 100% code coverage doesn't mean that the code has been thoroughly tested, it suggests that you have prioritized the codebase and the most important features of the project's development.
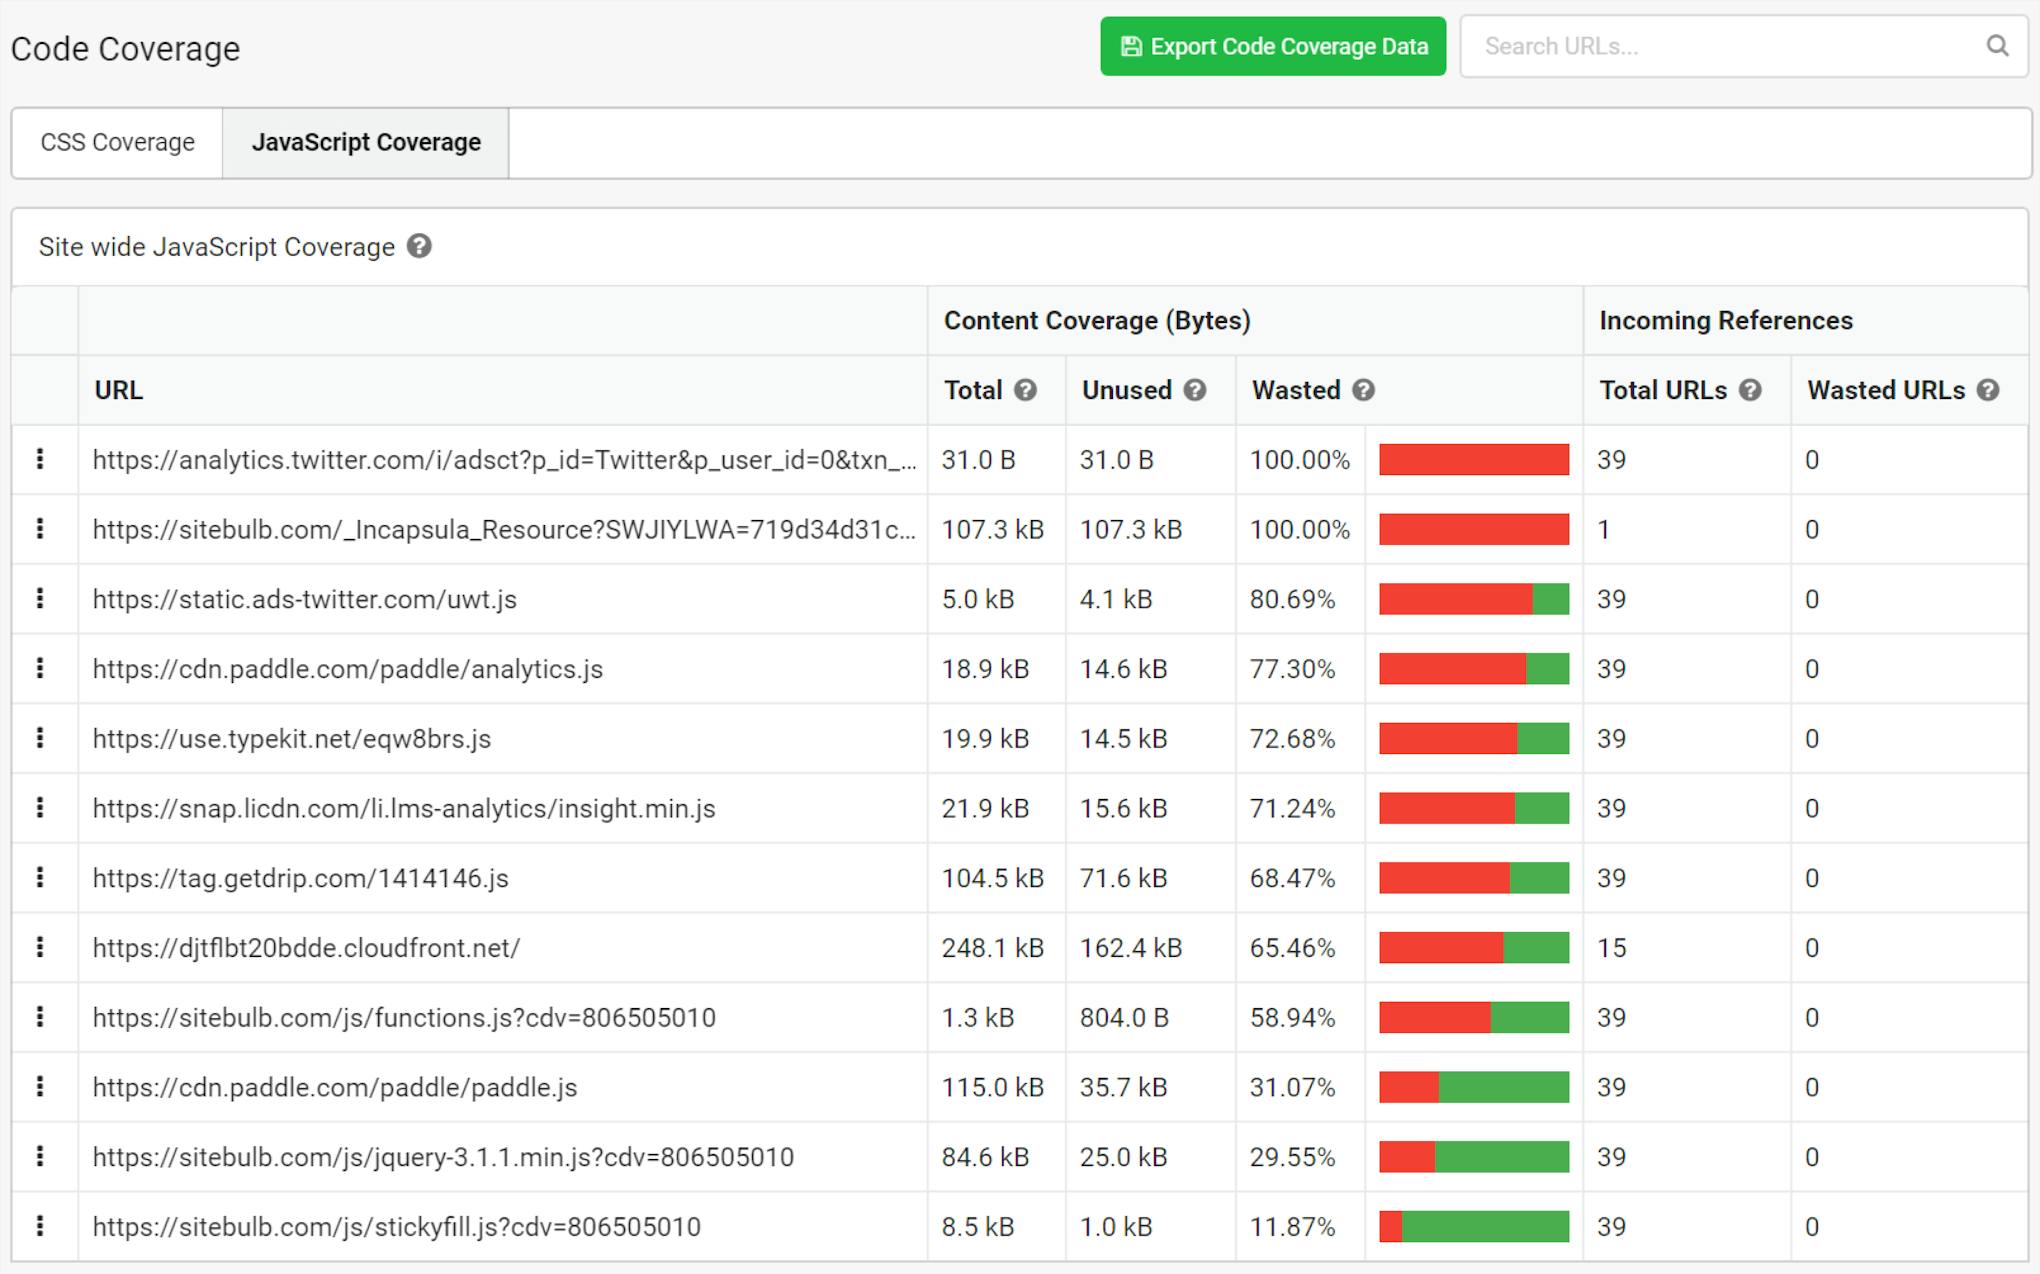
Example of code coverage with specific tool.
Code Stability
Code stability is difficult to measure. Stable code means that there are few changes to the software product that could potentially harm the business or software.
Some developers decide to chart the frequency of code changes. Others think of stability in terms of what percentage of deployed code results in downtime.
Code Simplicity
Code complexity is a more general KPI that can be measured through various metrics. One of these is the number of paths your code must take to get done. Code complexity is also a useful metric to measure the risks posed by various issues during development and testing. It can also help determine which parts of the code have the most bugs.
Code simplicity is a balance between the machine and human perception of complexity. The problem is that if you force developers to refactor their code into many sub-methods, they may make it harder for humans to understand. Having code that is easy to read will reduce the risks of long-term onboarding for new developers.
Code Churn
Code churn is a metric that measures the amount of code that changes over time. If the code has to be rewritten to accommodate a new feature, it could cause high maintenance.
Although it's primitive, code churn can be used to evaluate the stability of your code. It can also tell you which development stages are the most stable and which ones are not.
Look for regularities in code changes to identify issues that could be caused by the task-generation approach. If the code has spikes in code changes, it's important to investigate which tasks caused them. Doing so can help avoid generating unstable code.
The stability of your product is very important before a release. A growing trend can indicate that the code will most likely get rewritten before the release date, which could cause instability.

Example of code churn chart.

These metrics measure the performance and quality of a software company’s service. They should be chosen carefully and be based on your company's software development processes. Having a good understanding of these metrics can help you make informed decisions and improve the efficiency of your organization.
A quantitative indicator is typically the easiest to measure and can include various hard data such as operational costs and revenue. On the other hand, qualitative indicators are more complex to analyze, including factors such as customer feedback. Ideally, you should blend two qualitative and quantitative indicators to understand your company's performance better. However, you'll need more quantitative indicators to make effective reporting.
Best practices for choosing and tracking KPIs
- Each metric should be focused on a specific goal or objective. For example, the development team may want to improve the number of bugs reported or accelerate the completion of a task.
- A metric can be created in various ways. It can be easily set by default as the target metric, or it can be used to measure the progress of the entire process. Having a metric that tells the story of the development process is very useful for analyzing the overall trend.
- Use metrics to analyze the dynamics of the workflow, such as how it changes weekly or monthly.
- Instead of constantly interrupting the work, having multiple measurement periods can help determine the exact progress of the project. Doing so can give teams a better understanding of the problem, which causes the development team to waste time.
- If the project metrics do not provide valuable insights for reaching the team goals, stop using them. It suggests that you have chosen metrics that are not aligned with the goals or have no value to your project.
- The various metrics should be the subject of regular meetings and discussions among the team members. These sessions can help the team identify ways to improve the efficiency of the work processes.
- Do not try to use too many metrics, as they will just bury you in numbers. Instead, select a few carefully selected metrics to get more detailed insights.
- Although an analyst may be hired to collect the data, it is also important that the business manager is responsible for reporting on the measures. This person should be able to analyze the data and make the necessary changes to improve performance. He or she should also be able to influence the other individuals involved in the project.
- Having a clear understanding of the various elements of your strategy can help you make informed decisions and improve your organization's performance. If you see a positive trend in the implementation of a certain measure, but the associated objective still remains the same, then it’s time to review the strategy and make changes.
How do software engineers measure KPIs?
One of the most important factors that businesses consider when implementing a strategy is the ability to visualize their data in a way that provides deep insights. This is especially true when dealing with multiple KPIs.
The ability to visualize data to get deep insights is crucial for businesses. It can help understand important data points and make informed decisions.
It is also vital that businesses regularly evaluate their KPIs to make sure that they are still relevant and focused on the areas that need attention.
The specific tools you will use to measure KPIs will depend on the systems your teams and employees use to do their job. Marketing teams can use Google Analytics to measure their KPIs, sales teams can use CRM, and support teams can use help desk reports.
At Mad Devs, we use an information radiator. It is commonly utilized as a tool to visualize the various parts of the workflow. Even though it's a tool, it can also be customized to display different data types. When the team is discussing the details of a project, a radiator can be presented in various messages sent to the team.
The other way is to use KPI dashboards. Using a KPI dashboard, companies can monitor and make informed decisions about how they should approach the goals of their projects. For example, here is a dashboard for Jira. There are many types of KPI dashboards on the market. From simple to advanced, all you need to choose is the right functionality set and a suitable budget.
Example of the importance of using KPIs
The speed of a website's development is a metric that helps determine a visitor's first impression of the business or web page. The goal of developers and testers is to make a website as functional and beautiful as possible. However, if the content or the features are not optimized, it can negatively affect the website's speed.
A website's speed is also important to the success of its users. According to a study, 47% of people expect a web page to load in less than two seconds. It can cost businesses millions for every second it takes to load a page.
Google stated that they use a speed obsession for every product on the web. Matt Cutts, the company's former head of web spam, admitted that fast load speed is a positive factor in a website's ranking.
One-second delays can result in a 7% decrease in conversions, especially for e-commerce websites. For instance, if a website that makes $50,000 per day has a delay of one second, it could cost the business around $1.28 million in lost revenue.
The speed of a website is a crucial indicator of a project's success. It can affect a user's experience and lead to a lower search ranking. In June 2019, Mad Devs created faster pages than Clutch.co's previous pages.
Due to the increasing number of customers and website traffic, 800K unique users per month, Clutch has experienced significant technical challenges. The company's previous solution could not sustain the high traffic levels needed to support its growing user base. The monolithic architecture of the platform had become an issue.
Here is the table of comparison:

To learn more, read this case study:

How do we set KPIs at Mad Devs?
At Mad Devs, we are focused on delivering value to our customers. We are constantly looking for ways to improve the customer experience and ensure they benefit from our efforts. This approach helps us prioritize our customers' business success over other goals.
Getting the right strategy and planning is crucial to ensure the project is successful. The first step in the process is gathering a group of people focused on making the project successful.
This group of people is also called SWAT team members. The next step is conducting a SWAT analysis.
A SWAT analysis is a process that can be used to evaluate the current state of a project or product. It can also identify areas of potential improvement that need to be made. This type of analysis helps organizations identify areas of their operations where they can improve their efficiency. It includes two objectives:
- Assess the customer’s business needs
- Assess Mad Devs’ resources and the feasibility of meeting the identified needs
Only after that can we move to the Statement of Work. And here is the most important part that is related to our topic. In close cooperation with the customer, we define target metrics for the product, which also need to be closed, after the release and a number of iterations on the product, at the stage of forming the Statement of Work.
After a project has entered the implementation stage, the SWAT team members are responsible for overseeing the project's development. They also provide recommendations to the team.
To wrap up
Mad Devs’ experienced software engineers can help you achieve the best possible results. We use new technologies and automation and apply our experience and expertise for the growth and development of our client's businesses, as the success of our clients is our success, and their growth is our growth too. Due to tech solutions developed by Mad Devs, 5 of our startup clients received more than $10 million in funding in 2019. We can help you manage the development cost and provide the highest quality software that will meet or exceed the expectations of KPIs.
To get a free consultation on your project, you can simply сontact us now.


How Much Does It Cost to Make a Unique NFT Marketplace...
How Much Does It Cost to Make a...
How Much Does It Cost to Make a Unique NFT Marketplace from Scratch
The popularity of digital marketplaces for various types of products is increasing day by day. Especially when there is a sudden turnaround in the...